THE FLEETI BLOG
Dashboard or email report: which reporting format should you use to manage your fleet?
A dashboard shows your fleet in real time, an email report analyses a period: how to make the most of these two reporting formats.

Co-founder and Chairman
Last updated
AT A GLANCE
The dashboard: a graphical, customisable real-time view of the fleet, to be checked at least once a day so you can act quickly.
The email report: an automatic summary of a period, sent to the right people, to analyse and make long-term decisions.
With Fleeti: Fleeti, the SaaS fleet management and telematics software founded in 2020, offers both formats: customisable real-time dashboards and reports sent automatically by email, including the Risk Management Report. More than 1,000 clients use it, supported by local teams in 7 countries across France and Africa.
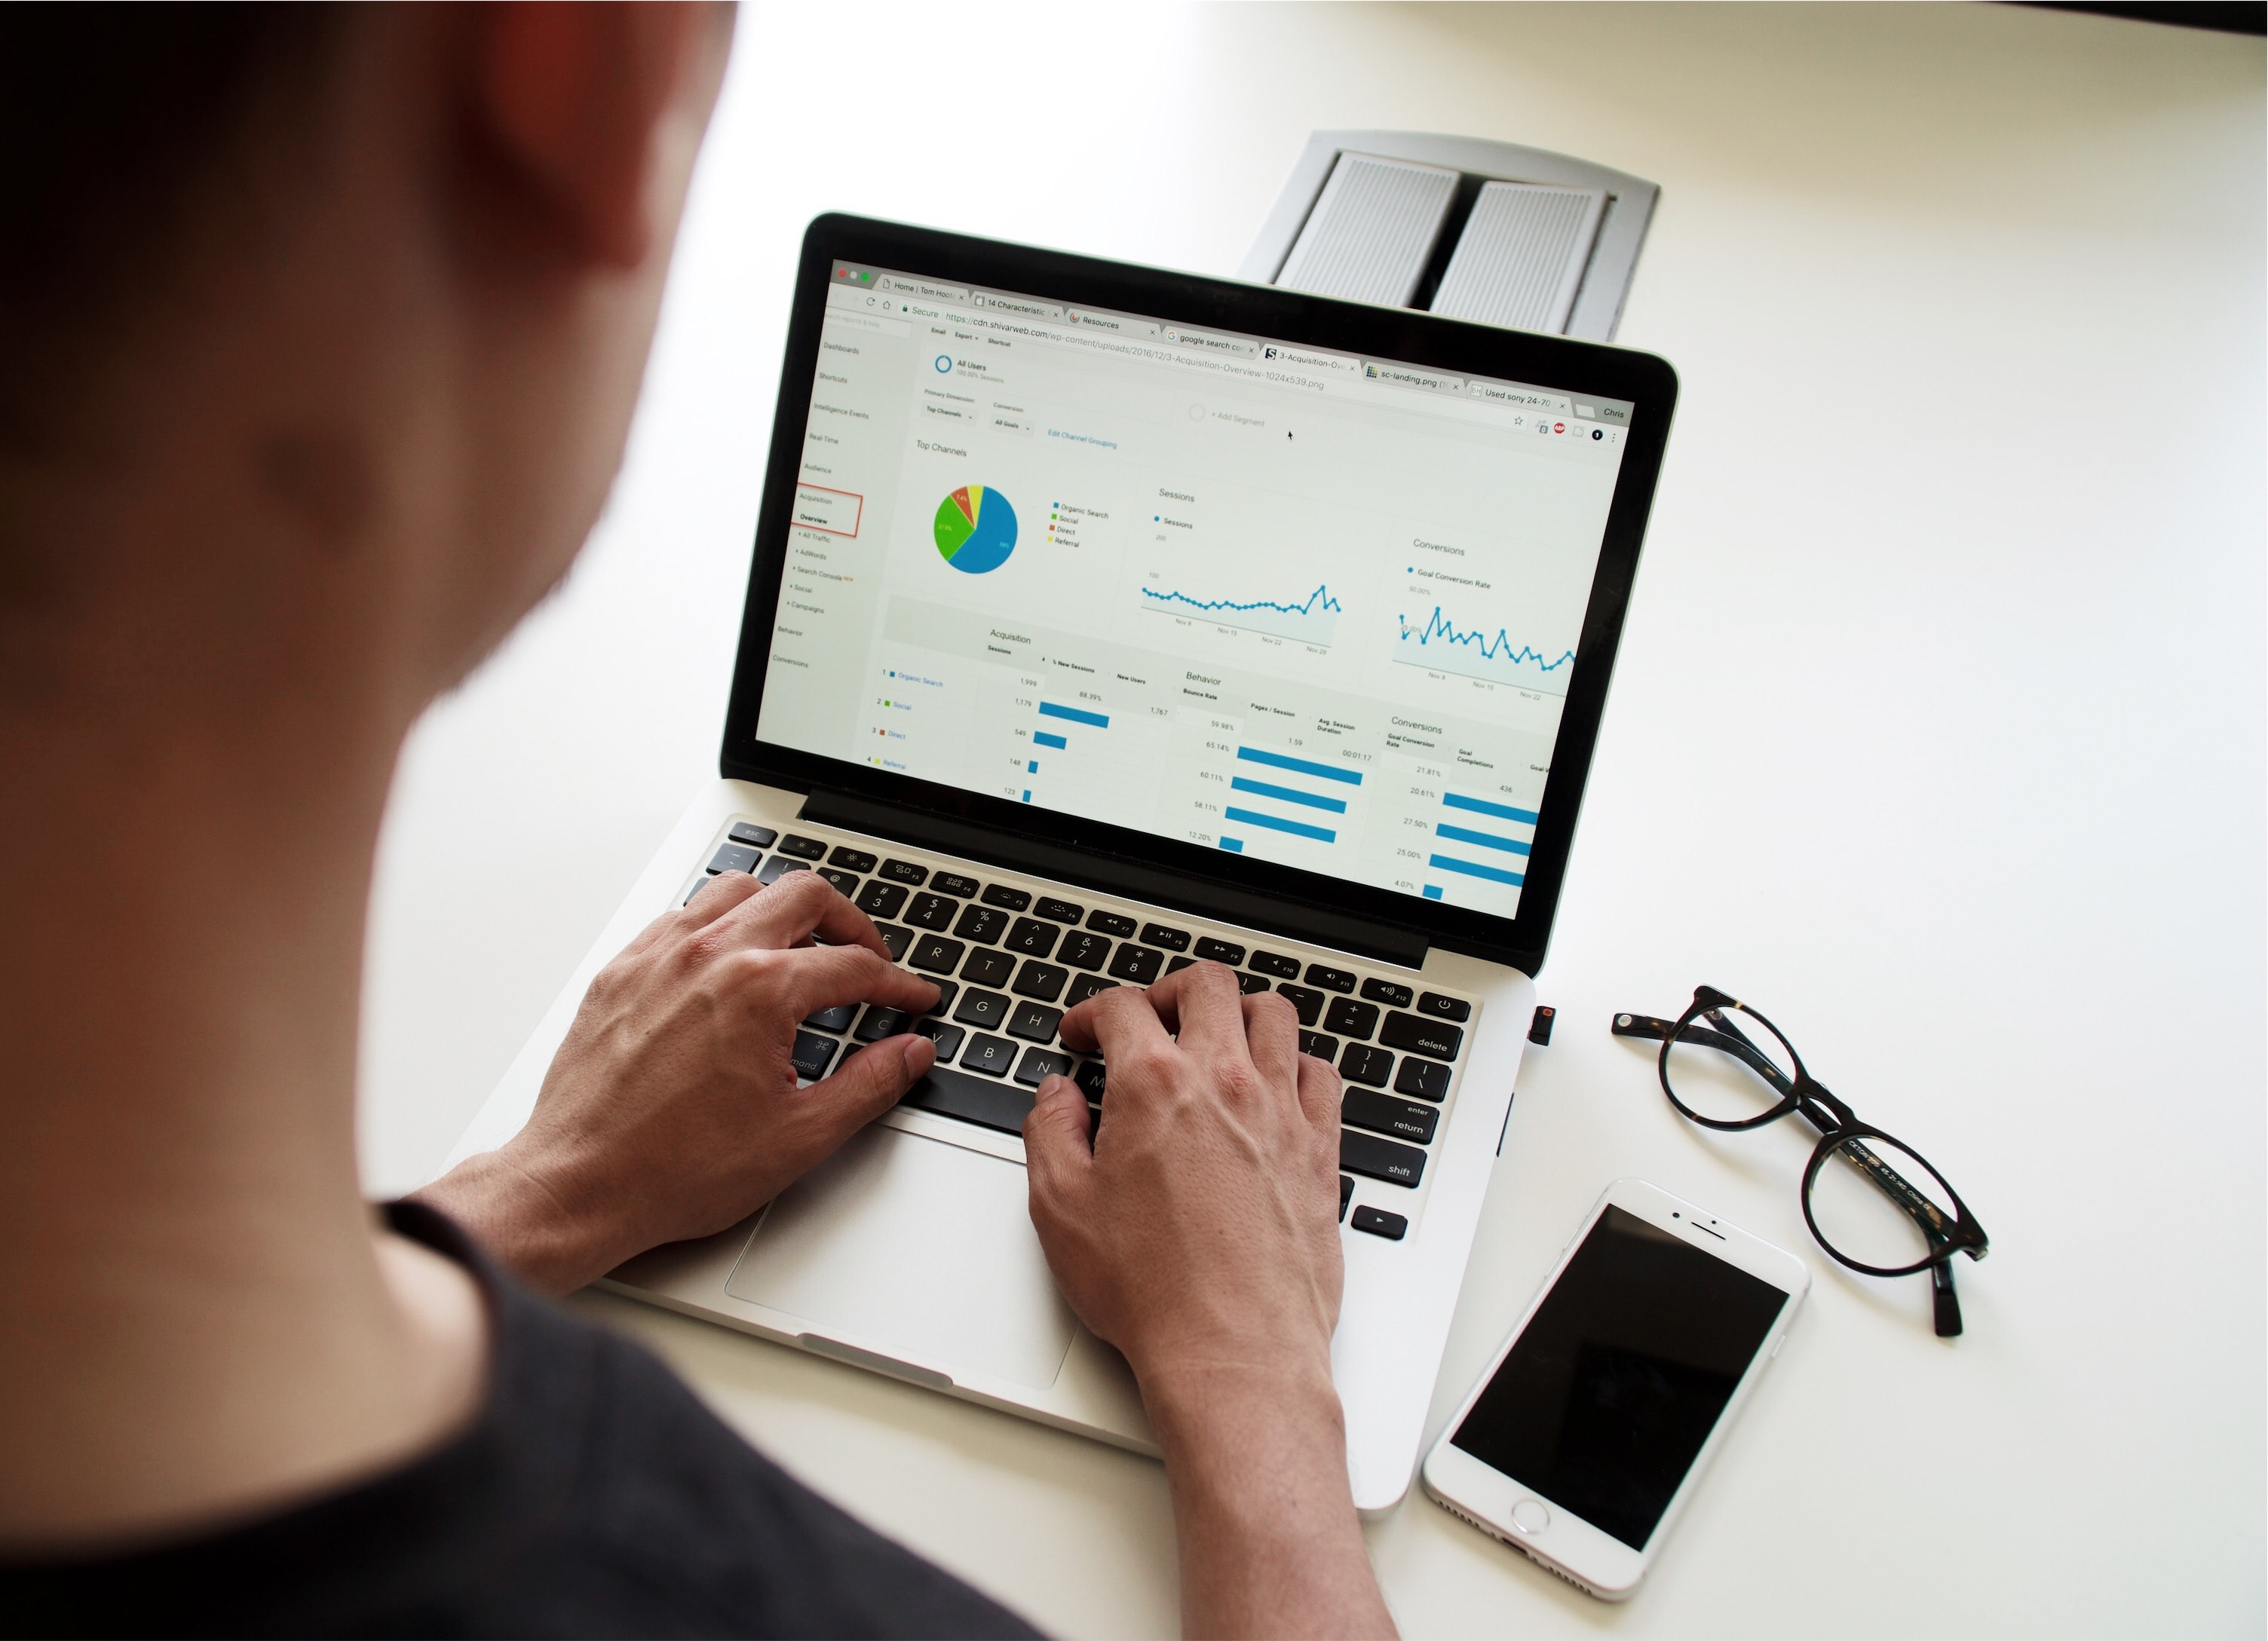
A dashboard displays the status of your fleet in real time so you can act day to day. A report sent by email summarises a period so you can step back and make long-term decisions. These two reporting formats are the most widely used for monitoring a vehicle fleet, and they complement each other.
Having dashboards and reports at your disposal is good. Understanding what they are for and using them to improve your fleet is better. Here is how to get the most out of each one.
What is a fleet management dashboard?

Dashboards let you see the status of your fleet at a glance.
A dashboard is any report that graphically represents a parameter or a fleet KPI. This format gives you a quick overview of the status of your fleet. For example, you can follow the curve of your fuel consumption.
One of the most widely used dashboards is the fuel monitoring dashboard. For each vehicle, you can follow the amount of fuel in the tank in real time, which makes it possible to detect theft, among other things. In the regions where we operate, fuel theft is a major issue: we have devoted a guide to it, how to prevent fuel theft.
Before fleet management software came along, these thefts were detected late, if at all. By checking your dashboards regularly, you can now spot a sudden, unusual drop in fuel. Alerts also automatically flag any suspicious drop in the level.
These dashboards are often fully customisable. On the platform, you choose the information that matters to you, which is then displayed as a dashboard on your home page.
How often should you check your fleet dashboard?
The dashboard shows the state of the fleet at any given moment. It is therefore worth checking it at least once a day. In some industries, such as last-mile delivery, it is checked several times a day to track delivery progress and compare it with the planned schedule.
The information is updated in real time: what you see always reflects the reality on the ground.
What is a fleet report sent by email?

Reports sent by email help you take a step back on the state of the fleet and focus on long-term decisions.
Reports sent by email are more comprehensive than dashboards. They analyse data over a given period and summarise it, allowing you to go further in analysing the fleet and the measures to take. They are sent periodically to the relevant people in the company.
Their main advantage is that they are sent automatically: the fleet manager neither has to build the report nor go and find it on the platform. It arrives directly in their inbox, at the frequency set.
At Fleeti, one of the most requested reports is the Risk Management Report (RMR). It quickly gives an overall, concise view of the fleet over a given period. Discover all our reporting and dashboard features.
Dashboard or email report: which should you choose for your fleet?
The two formats meet different needs:
The dashboard: a real-time view, checked at least once a day, for one-off interventions such as a fuel alert or a late delivery.
The email report: a summary of a period, received automatically, to analyse what can be improved and make long-term decisions.
Each in its own way, these formats help you understand your fleet better so you can optimise it better. Fleeti reports are built on expertise and clarity: we believe everyone should be able to understand them. Your KPIs are therefore presented clearly and concretely, so you can easily make high-impact decisions. This is one of the pillars of the digitalisation of fleet management.
Want to find out more? Request a demo: we will be happy to answer your questions and discuss your needs.
What is the difference between a dashboard and a fleet report?
The dashboard displays the status of the fleet in real time so you can act day to day, for example on a suspicious drop in fuel. The report sent by email summarises the data for a given period so you can analyse trends and make long-term decisions. The two formats complement each other.