
The fleet dashboard that tracks your KPIs without Excel
The fleet dashboard that tracks your KPIs without Excel
The fleet dashboard that tracks your KPIs without Excel
Build your fleet dashboard with drag and drop, track your key indicators in real time (TCO, fuel use, availability, claims, driver score) and receive your reports automatically by email. Your field and administrative data consolidated in one interface, exportable to your ERP, accounting or management tool.
Build your fleet dashboard with drag and drop, track your key indicators in real time (TCO, fuel use, availability, claims, driver score) and receive your reports automatically by email. Your field and administrative data consolidated in one interface, exportable to your ERP, accounting or management tool.
Book a demo

The fleet dashboard that tracks your KPIs without Excel
Build your fleet dashboard with drag and drop, track your key indicators in real time (TCO, fuel use, availability, claims, driver score) and receive your reports automatically by email. Your field and administrative data consolidated in one interface, exportable to your ERP, accounting or management tool.
Book a demo
A library of ready-to-use KPIs
A library of ready-to-use KPIs
A library of ready-to-use KPIs
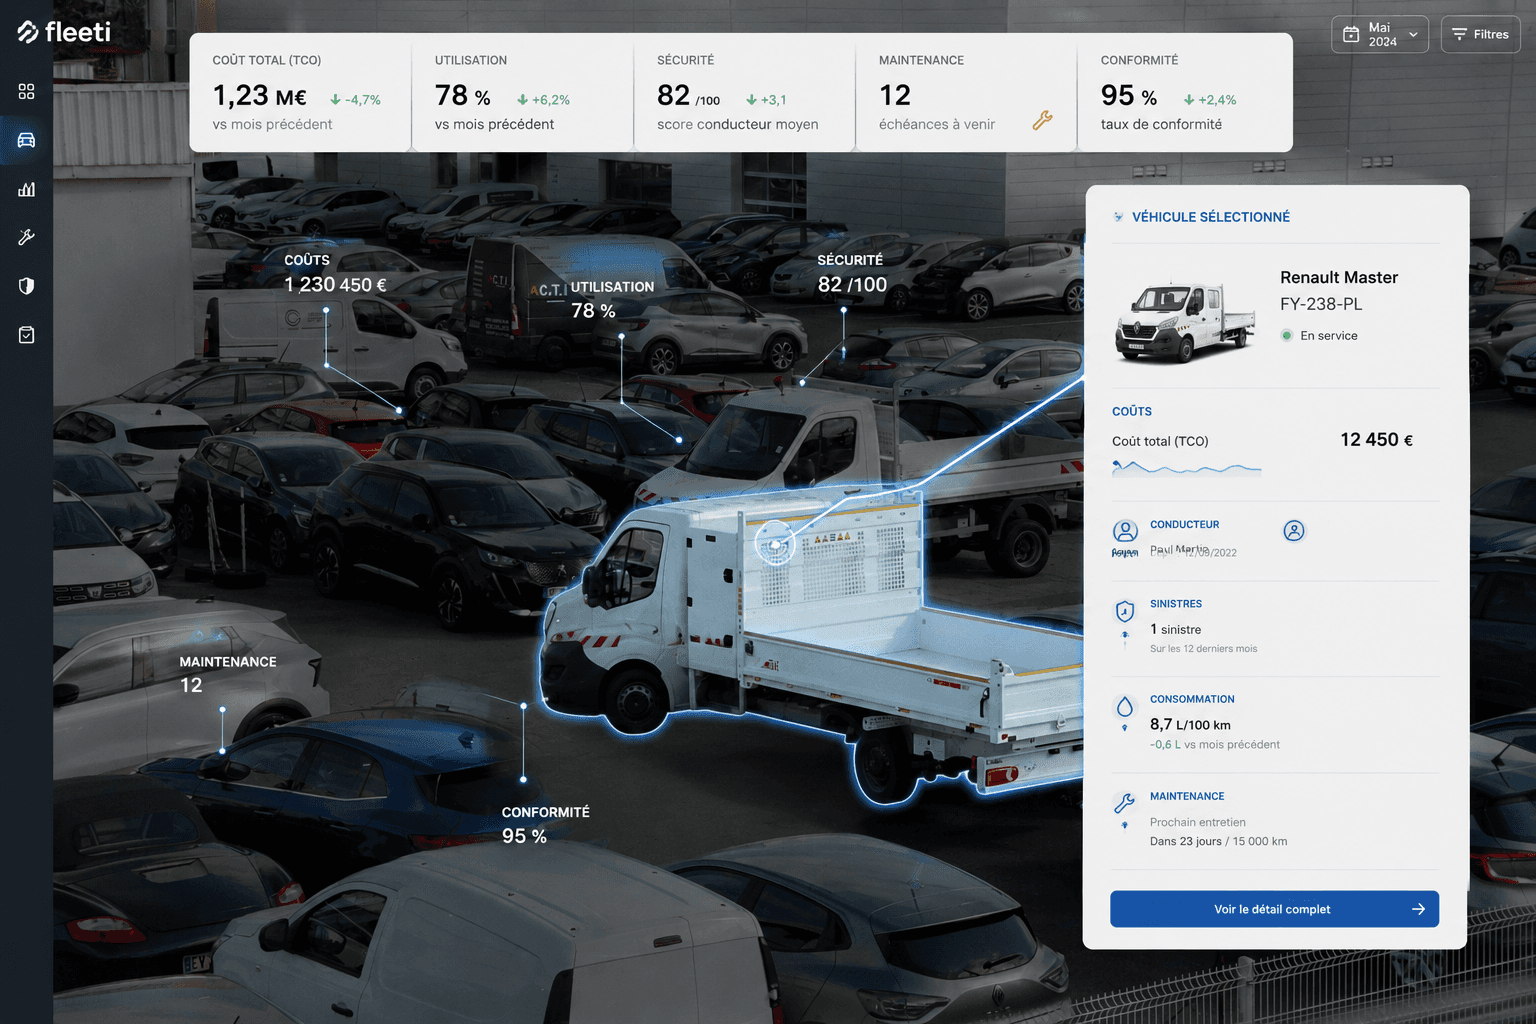
Fleet key performance indicators (KPIs) fall into five families. Fleeti includes more than fifty ready-to-use indicators, calculated automatically from your real data. No manual entry, no consolidation to do.
Fleet key performance indicators (KPIs) fall into five families. Fleeti includes more than fifty ready-to-use indicators, calculated automatically from your real data. No manual entry, no consolidation to do.
Costs: TCO, cost per km, budget variance, spend by category. Utilisation: utilisation rate, availability, kilometres driven. Safety: driver score, claims, risky behaviour. Maintenance: servicing due dates, downtime, maintenance cost. Compliance: benefits in kind, roadworthiness tests, traffic fines, CO2 emissions.
Costs: TCO, cost per km, budget variance, spend by category. Utilisation: utilisation rate, availability, kilometres driven. Safety: driver score, claims, risky behaviour. Maintenance: servicing due dates, downtime, maintenance cost. Compliance: benefits in kind, roadworthiness tests, traffic fines, CO2 emissions.
Every indicator can be broken down by vehicle, driver, site, period or tax category. Clicking an aggregated figure opens the line-by-line detail: this drill-down turns your dashboard into an analysis tool.
Inmanufacturing, breaking data down by site lets you compare several plants without manual consolidation, while each site manager keeps their own view.
Build your dashboard with drag and drop
Build your dashboard with drag and drop
Build your dashboard with drag and drop
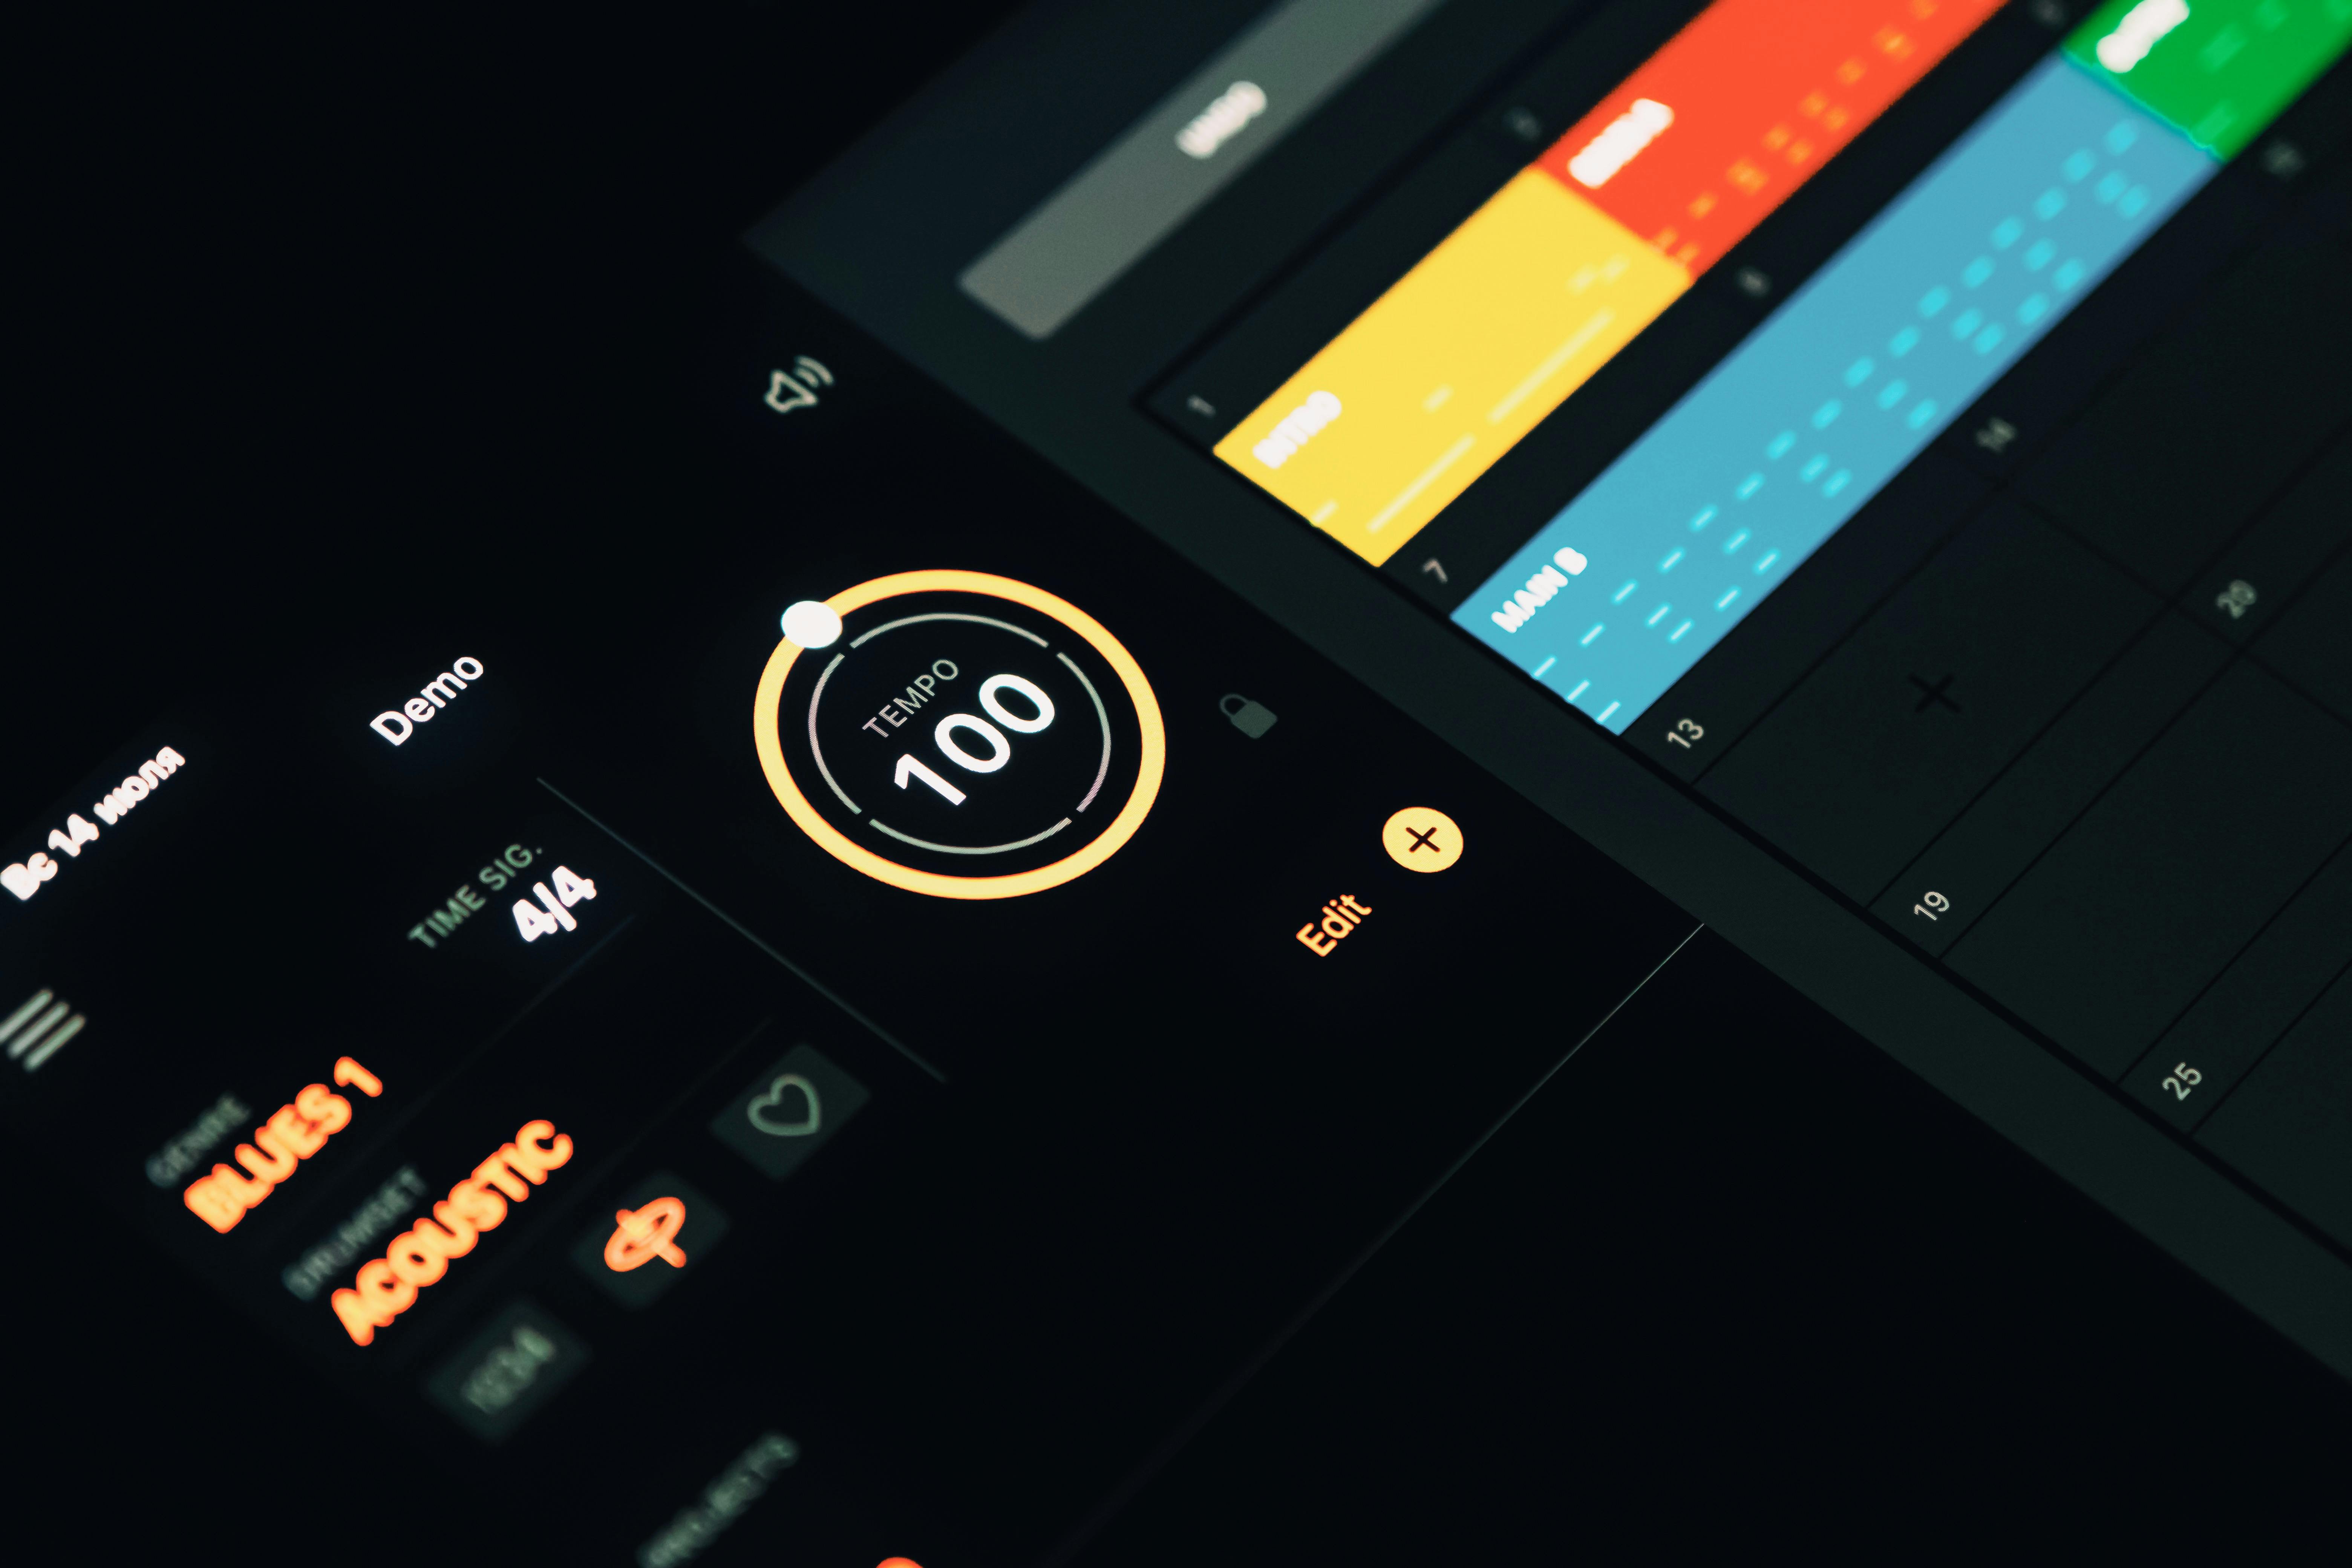
You build your fleet dashboard by selecting indicators from a library, placing them on a grid with drag and drop, and choosing the display format (chart, gauge, table, map). No code, no export to a third-party tool, no prior training.
You build your fleet dashboard by selecting indicators from a library, placing them on a grid with drag and drop, and choosing the display format (chart, gauge, table, map). No code, no export to a third-party tool, no prior training.
It works like modern productivity tools: you choose what you want to see, place it where you want and save. You can create as many dashboards as you need and switch between them in one click.
It works like modern productivity tools: you choose what you want to see, place it where you want and save. You can create as many dashboards as you need and switch between them in one click.
Filters are dynamic: change the period, vehicle scope or site, and every indicator recalculates. Your views are saved and available on the web platform and the iOS and Android mobile app, for viewing and editing.
Filters are dynamic: change the period, vehicle scope or site, and every indicator recalculates. Your views are saved and available on the web platform and the iOS and Android mobile app, for viewing and editing.
A dashboard for each role, with user permissions
A dashboard for each role, with user permissions
A dashboard for each role, with user permissions
An effective fleet dashboard differs depending on who uses it, and so does the data they can access. Fleeti offers preconfigured views by role and granular access control (view, edit, visible vehicle scope), compliant with ISO 27001 and the GDPR.
An effective fleet dashboard differs depending on who uses it, and so does the data they can access. Fleeti offers preconfigured views by role and granular access control (view, edit, visible vehicle scope), compliant with ISO 27001 and the GDPR.
Finance and management control for a sales fleet : overall and per-vehicle TCO, cost per km, budget variance, spend by category (fuel, maintenance, insurance, tax), benefit-in-kind tracking, annual projection.
Finance and management control for a sales fleet : overall and per-vehicle TCO, cost per km, budget variance, spend by category (fuel, maintenance, insurance, tax), benefit-in-kind tracking, annual projection.
Fleet manager: utilisation rate, availability, open alerts, fines awaiting driver designation, contracts nearing expiry, active drivers. Workshop and maintenance manager: servicing due dates, fault codes, engine hours per machine, downtime, open work orders, maintenance cost per vehicle.
Fleet manager: utilisation rate, availability, open alerts, fines awaiting driver designation, contracts nearing expiry, active drivers. Workshop and maintenance manager: servicing due dates, fault codes, engine hours per machine, downtime, open work orders, maintenance cost per vehicle.


Receive your reports automatically by email
Receive your reports automatically by email
Receive your reports automatically by email
You automate your fleet management reports by setting the content (KPIs, period, scope), the frequency (daily, weekly, monthly, quarterly) and the list of recipients. The report is sent by email as a PDF or Excel file, on the date and at the time you choose, with no manual work.
You automate your fleet management reports by setting the content (KPIs, period, scope), the frequency (daily, weekly, monthly, quarterly) and the list of recipients. The report is sent by email as a PDF or Excel file, on the date and at the time you choose, with no manual work.
The CFO receives the consolidated monthly report on the first Monday of the month. The fleet manager gets the weekly summary every Friday evening. The workshop manager receives the list of services to schedule every Monday morning. Each recipient gets exactly what they need.
The CFO receives the consolidated monthly report on the first Monday of the month. The fleet manager gets the weekly summary every Friday evening. The workshop manager receives the list of services to schedule every Monday morning. Each recipient gets exactly what they need.
You stay in control: edit the list, pause temporarily, add a recipient, change the frequency. Reports are archived in the platform, available afterwards and shareable via a secure link.
You stay in control: edit the list, pause temporarily, add a recipient, change the frequency. Reports are archived in the platform, available afterwards and shareable via a secure link.
Export your data to your business tools
Export your data to your business tools
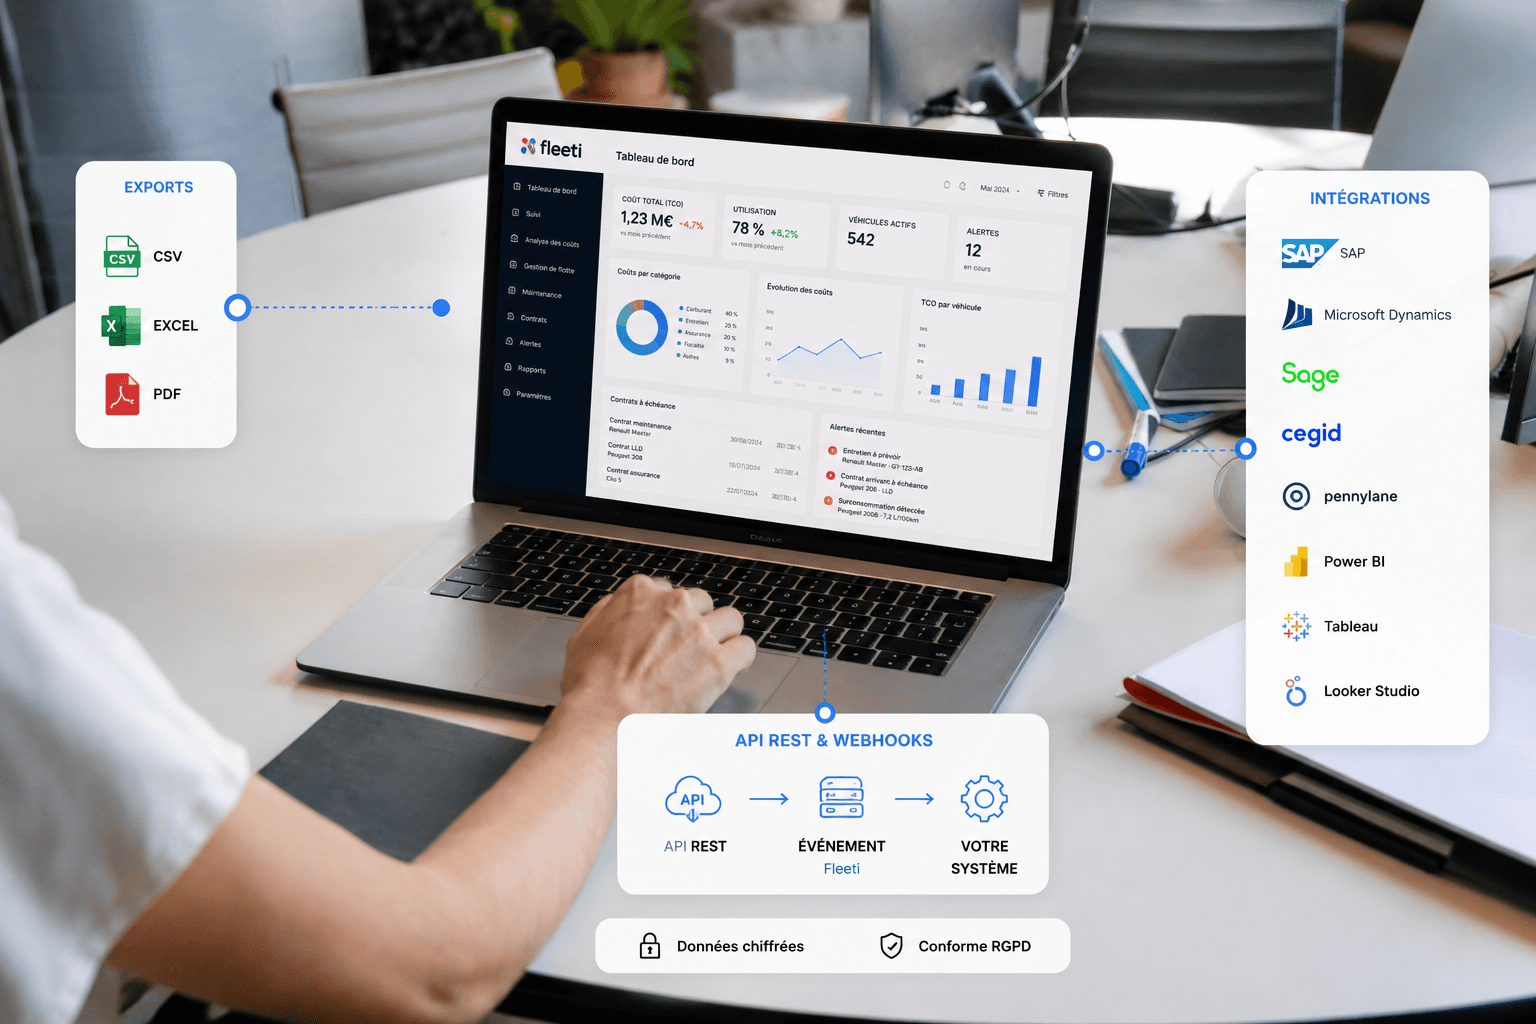
All Fleeti fleet dashboard data can be exported to CSV, Excel or PDF in one click. For automated flows, the documented REST API connects Fleeti to your ERP (SAP, Microsoft Dynamics), accounting (Sage, Cegid, Pennylane), payroll tool or Business Intelligence platform (Power BI, Tableau, Looker Studio).
All Fleeti fleet dashboard data can be exported to CSV, Excel or PDF in one click. For automated flows, the documented REST API connects Fleeti to your ERP (SAP, Microsoft Dynamics), accounting (Sage, Cegid, Pennylane), payroll tool or Business Intelligence platform (Power BI, Tableau, Looker Studio).
All Fleeti fleet dashboard data can be exported to CSV, Excel or PDF in one click. For automated flows, the documented REST API connects Fleeti to your ERP (SAP, Microsoft Dynamics), accounting (Sage, Cegid, Pennylane), payroll tool or Business Intelligence platform (Power BI, Tableau, Looker Studio).
Exports cover one-off needs: preparing a management meeting, feeding an external tracking file, sending data to an auditor. The REST API covers recurring needs: sending mileage to payroll for benefit-in-kind calculation, exporting costs by cost centre to accounting, syncing contracts with the purchasing system.
Exports cover one-off needs: preparing a management meeting, feeding an external tracking file, sending data to an auditor. The REST API covers recurring needs: sending mileage to payroll for benefit-in-kind calculation, exporting costs by cost centre to accounting, syncing contracts with the purchasing system.
Exports cover one-off needs: preparing a management meeting, feeding an external tracking file, sending data to an auditor. The REST API covers recurring needs: sending mileage to payroll for benefit-in-kind calculation, exporting costs by cost centre to accounting, syncing contracts with the purchasing system.
Webhooks take it further: a Fleeti event (new claim, contract end, threshold breach) immediately triggers an action in your system. All transmissions are encrypted and GDPR-compliant.
Webhooks take it further: a Fleeti event (new claim, contract end, threshold breach) immediately triggers an action in your system. All transmissions are encrypted and GDPR-compliant.
Webhooks take it further: a Fleeti event (new claim, contract end, threshold breach) immediately triggers an action in your system. All transmissions are encrypted and GDPR-compliant.
Unified data: field and admin on the same dashboard
Unified data: field and admin on the same dashboard
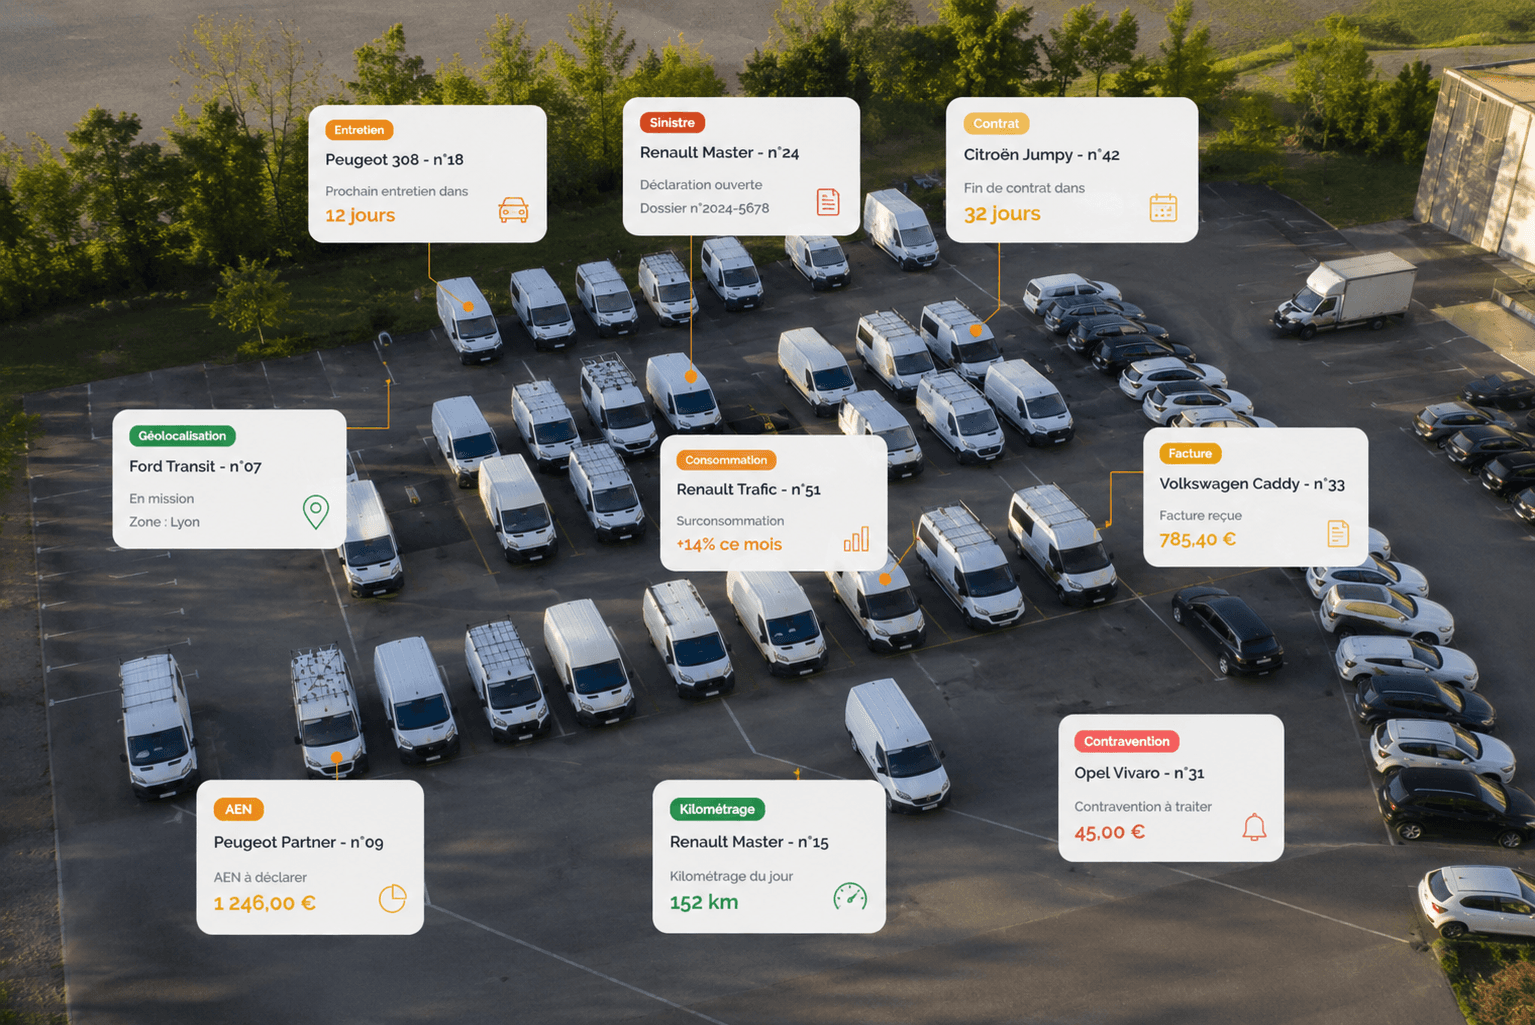
Fleeti consolidates data from on-board telematics (location, engine hours, engine data, fuel use) and administrative data (contracts, claims, benefits in kind, traffic fines, supplier invoices) in a single fleet dashboard. You no longer switch between several software tools or Excel exports to piece together a complete view.
Fleeti consolidates data from on-board telematics (location, engine hours, engine data, fuel use) and administrative data (contracts, claims, benefits in kind, traffic fines, supplier invoices) in a single fleet dashboard. You no longer switch between several software tools or Excel exports to piece together a complete view.
A vehicle's actual cost per kilometre is the sum of its lease, fuel, maintenance, insurance, tax and claims. In most companies, this data sits in five different systems. Fleeti brings it together.
A vehicle's actual cost per kilometre is the sum of its lease, fuel, maintenance, insurance, tax and claims. In most companies, this data sits in five different systems. Fleeti brings it together.
A vehicle's actual cost per kilometre is the sum of its lease, fuel, maintenance, insurance, tax and claims. In most companies, this data sits in five different systems. Fleeti brings it together.
This unification is what separates a true fleet dashboard from a simple tracking tool or admin software. It is what makes management based on real data, rather than self-reported data, possible.
This unification is what separates a true fleet dashboard from a simple tracking tool or admin software. It is what makes management based on real data, rather than self-reported data, possible.
This unification is what separates a true fleet dashboard from a simple tracking tool or admin software. It is what makes management based on real data, rather than self-reported data, possible.
Book a demo
Three complementary tools to manage your fleet
Three complementary tools to manage your fleet
Three complementary tools to manage your fleet
The dashboard shows your fleet's status in real time. Scheduled reports deliver periodic analysis by email. Alerts warn you immediately of a critical event. The three work together.

Dashboard
Dashboard
Dashboard
Dashboard
Your day-to-day management view. It consolidates the indicators you choose on a single interface, with clickable charts that drill down to vehicle-level data.
Your day-to-day management view. It consolidates the indicators you choose on a single interface, with clickable charts that drill down to vehicle-level data.
Scheduled reports
Scheduled reports
Scheduled reports
Scheduled reports
Extracts scheduled at a set frequency (daily, weekly, monthly, quarterly), sent automatically by email as PDF or Excel files to the recipients you choose.
Extracts scheduled at a set frequency (daily, weekly, monthly, quarterly), sent automatically by email as PDF or Excel files to the recipients you choose.
Extracts scheduled at a set frequency (daily, weekly, monthly, quarterly), sent automatically by email as PDF or Excel files to the recipients you choose.
Alerts & notifications
Alerts & notifications
Alerts
notifications
Alerts & notifications
Instant notifications triggered by a threshold or event: excess mileage, roadworthiness test due, fuel anomaly, zone exit. You get the signal without having to check the platform.
Instant notifications triggered by a threshold or event: excess mileage, roadworthiness test due, fuel anomaly, zone exit. You get the signal without having to check the platform.
Instant notifications triggered by a threshold or event: excess mileage, roadworthiness test due, fuel anomaly, zone exit. You get the signal without having to check the platform.
Frequently asked questions about the Fleeti fleet dashboard
See your fleet differently. Book a 30-minute demo and we will set up a first dashboard with your priority KPIs.
See your fleet differently. Book a 30-minute demo and we will set up a first dashboard with your priority KPIs.
Book a demo

IoT for the operations of African and European businesses.


© 2026 Fleeti SAS