


Optimise your fleet TCO

Optimise your fleet TCO

Optimise your fleet TCO

Reduce each vehicle's total cost of ownership (TCO) and your business fleet's operating costs. Fleeti consolidates your spending (energy, maintenance, tax, claims, contracts) with actual usage data, ranks savings levers by vehicle and quantifies the expected gain before every decision.

Reduce each vehicle's total cost of ownership (TCO) and your business fleet's operating costs. Fleeti consolidates your spending (energy, maintenance, tax, claims, contracts) with actual usage data, ranks savings levers by vehicle and quantifies the expected gain before every decision.

Book a demo

Optimise your fleet TCO

Reduce each vehicle's total cost of ownership (TCO) and your business fleet's operating costs. Fleeti consolidates your spending (energy, maintenance, tax, claims, contracts) with actual usage data, ranks savings levers by vehicle and quantifies the expected gain before every decision.

Book a demo

Measure what your fleet really costs

Measure what your fleet really costs

Measure what your fleet really costs

A business vehicle costs €10,000 a year on average, with up to 60% of that invisible in standard accounts: tax, depreciation, claims, administration and traffic fines.

A business vehicle costs €10,000 a year on average, with up to 60% of that invisible in standard accounts: tax, depreciation, claims, administration and traffic fines.

Fleeti aggregates invoices from all your suppliers (leasing companies, fuel suppliers, garages, insurers) and cross-checks them with actual driving data from connected vehicles.

Fleeti aggregates invoices from all your suppliers (leasing companies, fuel suppliers, garages, insurers) and cross-checks them with actual driving data from connected vehicles.

You move from reported TCO to measured TCO, reliable and defensible to the finance team, calculated by vehicle, site and use. The approach is the same whether your fleet serves internal operations or is used for rental.

You move from reported TCO to measured TCO, reliable and defensible to the finance team, calculated by vehicle, site and use. The approach is the same whether your fleet serves internal operations or is used for rental.

Identify your five priority savings levers

Identify your five priority savings levers

Identify your five priority savings levers

Not all TCO levers are equal. For the same fleet, energy can account for 28% of a combustion vehicle's TCO while maintenance accounts for only 8%.

Not all TCO levers are equal. For the same fleet, energy can account for 28% of a combustion vehicle's TCO while maintenance accounts for only 8%.

Fleeti ranks your savings levers (energy and fuel, replacement and electrification, suppliers and contracts, driver behaviour, fleet size) by quantified potential gain, vehicle by vehicle.

Fleeti ranks your savings levers (energy and fuel, replacement and electrification, suppliers and contracts, driver behaviour, fleet size) by quantified potential gain, vehicle by vehicle.

You know where to focus first, why, and what return to expect within three to six months.

You know where to focus first, why, and what return to expect within three to six months.

Anticipate the 2025 and 2026 tax impact on your TCO

Anticipate the 2025 and 2026 tax impact on your TCO

Anticipate the 2025 and 2026 tax impact on your TCO

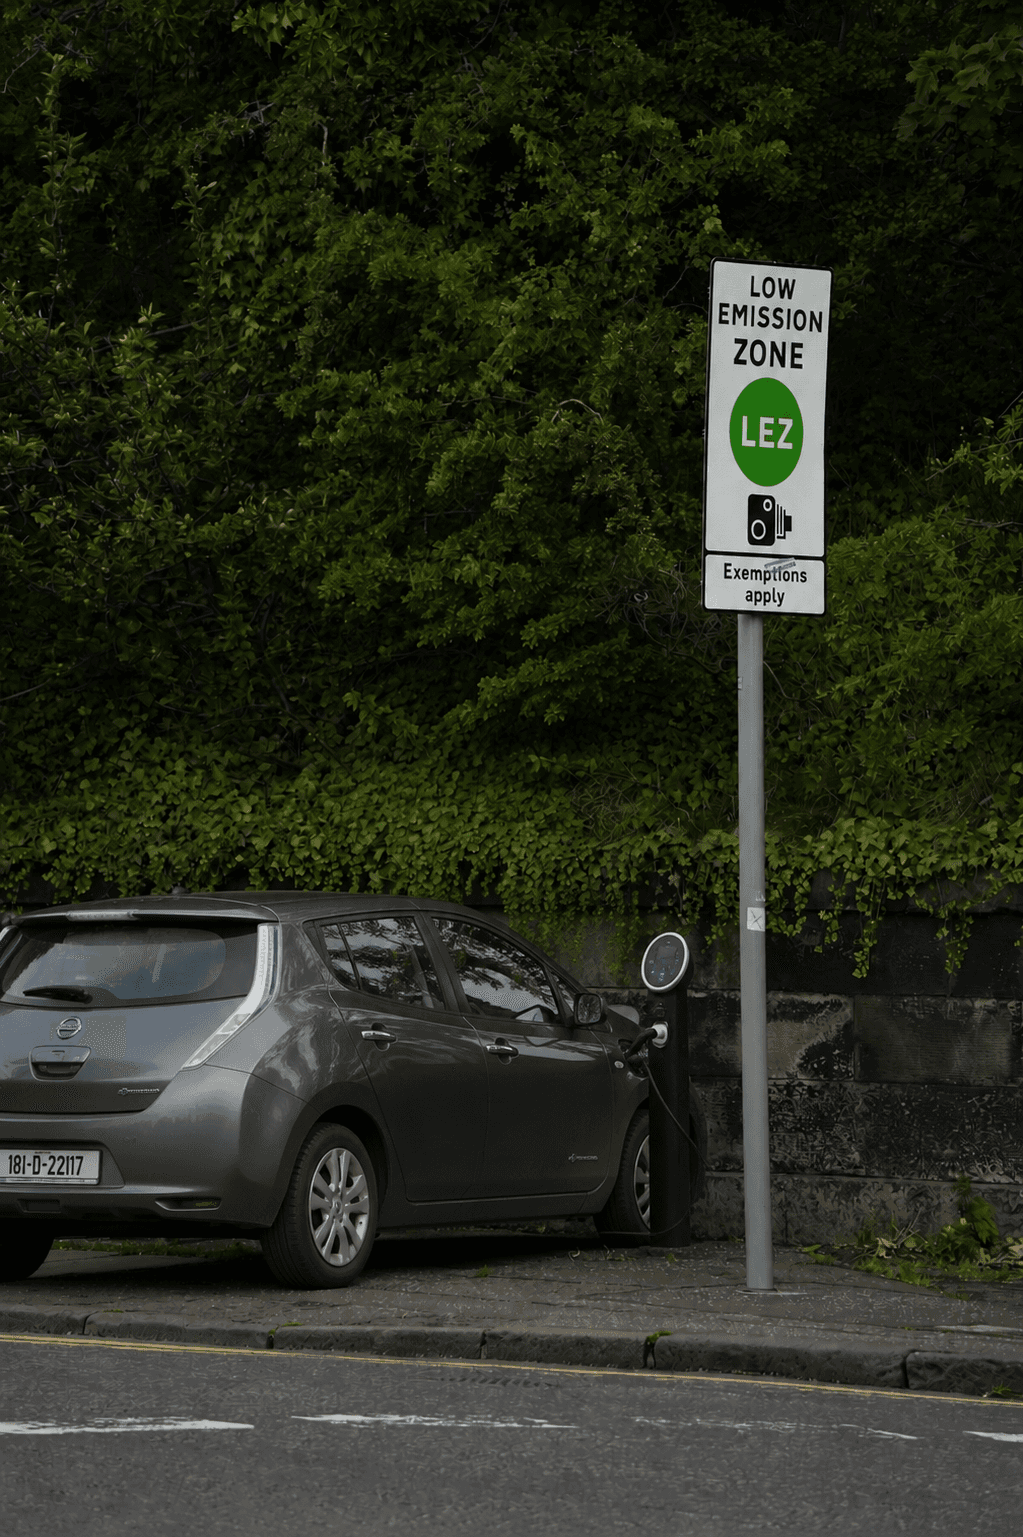
In France, the end of the company vehicle tax (TVS), the arrival of the annual greening incentive tax, the benefit-in-kind reform of 1 February 2025 and tougher low-emission zones are reshaping the real cost of every vehicle in your fleet.

In France, the end of the company vehicle tax (TVS), the arrival of the annual greening incentive tax, the benefit-in-kind reform of 1 February 2025 and tougher low-emission zones are reshaping the real cost of every vehicle in your fleet.

Fleeti includes these new scales, feeds your CSRD (Corporate Sustainability Reporting Directive) reporting and calculates, for each vehicle, the expected tax cost or saving over the next twelve months.

Fleeti includes these new scales, feeds your CSRD (Corporate Sustainability Reporting Directive) reporting and calculates, for each vehicle, the expected tax cost or saving over the next twelve months.

You make informed choices between keeping, renegotiating, electrifying or removing a vehicle, without discovering the bill at year-end.

You make informed choices between keeping, renegotiating, electrifying or removing a vehicle, without discovering the bill at year-end.

Decide vehicle by vehicle: replace, electrify or remove

Decide vehicle by vehicle: replace, electrify or remove

Decide vehicle by vehicle: replace, electrify or remove

A replacement decision is often worth several thousand euros a year per vehicle. It cannot rest on a fleet average.

A replacement decision is often worth several thousand euros a year per vehicle. It cannot rest on a fleet average.

For each vehicle, Fleeti cross-checks actual TCO, actual use (kilometres, trip profile, utilisation, driver behaviour) and the projected TCO of combustion and electric alternatives.

For each vehicle, Fleeti cross-checks actual TCO, actual use (kilometres, trip profile, utilisation, driver behaviour) and the projected TCO of combustion and electric alternatives.

You get a costed recommendation for each asset, ready to defend to management and compatible with France's LOM law obligations.

You get a costed recommendation for each asset, ready to defend to management and compatible with France's LOM law obligations.

Book a demo

TCO optimisation in three figures

TCO optimisation in three figures

TCO optimisation in three figures

Optimising fleet TCO and controlling the cost of a vehicle fleet starts with three orders of magnitude: the share of hidden costs in the current budget, the typical saving per vehicle, and the room for manoeuvre on fuel.

60 %

60 %

60 %

Share of hidden costs in a business vehicle's TCO (tax, depreciation, claims, administration).

Share of hidden costs in a business vehicle's TCO (tax, depreciation, claims, administration).

1 950 €

1 950 €

1 950 €

Average annual savings per vehicle observed with a 5.9% reduction in fuel consumption.

Average annual savings per vehicle observed with a 5.9% reduction in fuel consumption.

Average annual savings per vehicle observed with a 5.9% reduction in fuel consumption.

15 %

15 %

15 %

Fuel reduction achievable through eco-driving training combined with telematics measurement.

Fuel reduction achievable through eco-driving training combined with telematics measurement.

Fuel reduction achievable through eco-driving training combined with telematics measurement.

Estimate the TCO savings available on your fleet

Estimate your fleet's actual TCO vehicle by vehicle. The Fleeti calculator includes every cost item and projects achievable savings for each electrification scenario. No account needed, instant results.

Energy and fuel

Energy and fuel

Energy and fuel

The largest item you can optimise, at 25 to 28% of a combustion vehicle's TCO. Tackled by measuring actual consumption, cutting excessive idling and eco-driving training.

The largest item you can optimise, at 25 to 28% of a combustion vehicle's TCO. Tackled by measuring actual consumption, cutting excessive idling and eco-driving training.

The largest item you can optimise, at 25 to 28% of a combustion vehicle's TCO. Tackled by measuring actual consumption, cutting excessive idling and eco-driving training.

Replacement and electrification

Replacement and electrification

Replacement and electrification

For a passenger car, the gap in cost per kilometre between a leased combustion vehicle (€0.476/km) and an eco-scored EV (€0.423/km) reached 11% in 2025, according to the Arval Mobility Observatory.

For a passenger car, the gap in cost per kilometre between a leased combustion vehicle (€0.476/km) and an eco-scored EV (€0.423/km) reached 11% in 2025, according to the Arval Mobility Observatory.

For a passenger car, the gap in cost per kilometre between a leased combustion vehicle (€0.476/km) and an eco-scored EV (€0.423/km) reached 11% in 2025, according to the Arval Mobility Observatory.

Suppliers and contracts

Suppliers and contracts

Suppliers and contracts

Renegotiating leases, adjusting contract mileage, and reviewing fuel cards, fleet insurance and ANTAI fine handling. An often untapped source of savings, for lack of objective data to present.

Renegotiating leases, adjusting contract mileage, and reviewing fuel cards, fleet insurance and ANTAI fine handling. An often untapped source of savings, for lack of objective data to present.

Renegotiating leases, adjusting contract mileage, and reviewing fuel cards, fleet insurance and ANTAI fine handling. An often untapped source of savings, for lack of objective data to present.

Driver behaviour

Driver behaviour

Driver behaviour

Driver TCO accounts for about 20% of total TCO, according to the Observatoire du Véhicule d'Entreprise. A measured eco-driving programme acts on fuel, maintenance and claims at the same time.

Driver TCO accounts for about 20% of total TCO, according to the Observatoire du Véhicule d'Entreprise. A measured eco-driving programme acts on fuel, maintenance and claims at the same time.

Driver TCO accounts for about 20% of total TCO, according to the Observatoire du Véhicule d'Entreprise. A measured eco-driving programme acts on fuel, maintenance and claims at the same time.

How to audit your fleet TCO in four steps

Auditing fleet TCO takes four successive steps: centralise all costs by vehicle, cross-check them with actual use, rank savings levers, then carry out a costed action plan. The reliability of usage data determines the quality of the audit.

Standard TCO formula

TCO = (acquisition cost + operating costs + financing costs - resale value) / total mileage

TCO = (acquisition cost + operating costs + financing costs - resale value) / total mileage

Standard breakdown used by the Observatoire du Véhicule d'Entreprise (OVE). Three parts: vehicle TCO (75%), driver TCO (20%) and fleet TCO (5%).

Standard breakdown used by the Observatoire du Véhicule d'Entreprise (OVE). Three parts: vehicle TCO (75%), driver TCO (20%) and fleet TCO (5%).

01

Map

Centralise all spending by vehicle over the last twelve months: purchase or lease payments, energy, servicing and preventive maintenance, tyres, insurance, tax (company vehicle taxes, benefits in kind, non-deductible depreciation), claims and ANTAI fines. At this stage, TCO is still a reported figure.

02

02

Measure

Measure

Measure each vehicle's actual use through telematics: kilometres driven, trip profile, utilisation, idling hours and driver behaviour. This is where reported TCO becomes actual TCO you can base decisions on.

03

Prioritise

Identify the priority savings lever for each vehicle and quantify the expected gain. An under-used vehicle leaves the fleet, a high-mileage combustion vehicle switches to electric, and an at-risk driver joins an eco-driving programme.

04

Decide and act

Build a 90-day action plan by site and manager. Measure the impact on TCO month by month, adjust the car policy accordingly, and defend decisions to management with solid figures.

Typical example

Typical example

Fleet of 50 combustion vehicles, 25,000 km a year

For a fleet of 50 combustion vehicles driving 25,000 km a year, total annual TCO is between €480,000 and €600,000 depending on powertrain and financing. A Fleeti TCO audit typically identifies 6 to 12% of achievable savings in the first twelve months, or €30,000 to €70,000 a year with the same fleet size. The three biggest levers are energy, switching to actual-cost benefits in kind for vehicles used mainly for business, and removing under-used vehicles from the fleet.

For a fleet of 50 combustion vehicles driving 25,000 km a year, total annual TCO is between €480,000 and €600,000 depending on powertrain and financing. A Fleeti TCO audit typically identifies 6 to 12% of achievable savings in the first twelve months, or €30,000 to €70,000 a year with the same fleet size. The three biggest levers are energy, switching to actual-cost benefits in kind for vehicles used mainly for business, and removing under-used vehicles from the fleet.

Why your actual TCO differs from your theoretical TCO

Theoretical TCO is calculated from list costs and standard usage assumptions. Actual TCO includes real fuel use, observed claims, driver behaviour and actual residual value. The gap between the two is commonly 10 to 20% per vehicle, almost always to the company's disadvantage.

Before the vehicle is assigned

Theoretical TCO

Theoretical TCO helps choose a vehicle before acquisition: purchase price, WLTP consumption, expected tax and estimated residual value. It is a projection based on manufacturer data and average assumptions. As long as the vehicle is used in line with this profile, actual TCO stays close to theoretical.

Theoretical TCO helps choose a vehicle before acquisition: purchase price, WLTP consumption, expected tax and estimated residual value. It is a projection based on manufacturer data and average assumptions. As long as the vehicle is used in line with this profile, actual TCO stays close to theoretical.

During the vehicle's life

Actual TCO

Actual TCO includes factors only connected vehicles can measure: real fuel use, idling, harsh braking, business and personal mileage, claim frequency and severity, and tyre wear. These belong to driver TCO, which accounts for about 20% of total TCO according to the Observatoire du Véhicule d'Entreprise.

Actual TCO includes factors only connected vehicles can measure: real fuel use, idling, harsh braking, business and personal mileage, claim frequency and severity, and tyre wear. These belong to driver TCO, which accounts for about 20% of total TCO according to the Observatoire du Véhicule d'Entreprise.

Closing the gap between theoretical and actual TCO requires continuous usage data, not an annual audit. With Fleeti, every connected vehicle feeds its own TCO in real time, and the gap to theoretical becomes a management indicator instead of a budget surprise.

2025-2026 tax timeline and its impact on your TCO

Three tax milestones are changing TCO for good and shaping fleet cost optimisation in France: the abolition of the company vehicle tax (TVS) on 1 January 2025, the benefit-in-kind reform of 1 February 2025, and the ramp-up of the annual greening incentive tax. Each must be anticipated vehicle by vehicle, not as a fleet average.

1 January 2025

Company vehicle tax (TVS) abolished

The company vehicle tax is replaced by two annual taxes on vehicles used for business. The impact varies: it penalises high-emission combustion vehicles and partly eases the burden on hybrids and EVs.

1 February 2025

Benefit-in-kind reform

The decree of 25 February 2025 raises the flat-rate benefit in kind for combustion vehicles (from 9 to 15% of the price including VAT) and grants a 70% allowance to eco-scored EVs. Employer social charges rise by up to €2,952 per combustion vehicle per year.

2025 and beyond

Annual incentive tax

The annual greening incentive tax (TAI) replaces the LOM law quotas, with a financial penalty for fleets behind on low-emission vehicle thresholds. It must be built into your replacement plan.

31 December 2027

End of the electric benefit-in-kind allowance

The 70% benefit-in-kind allowance for fully electric eco-scored vehicles is due to end. The TCO of EVs assigned to employees is expected to rise after this date, which should be factored into decisions now.

On a fleet of 100 combustion vehicles, the combined effect of abolishing the TVS and the benefit-in-kind reform alone can add €120,000 to €250,000 a year depending on profiles. Fleeti models this impact vehicle by vehicle and suggests the most cost-effective decisions.

Frequently asked questions about fleet TCO optimisation

How do you calculate a vehicle fleet's TCO?
Fleet TCO (total cost of ownership) is the sum of all a vehicle's costs over its lifecycle, divided by its total mileage. The usual formula is: TCO = (acquisition cost + operating costs + financing costs, minus resale value) divided by total mileage. Operating costs include energy, maintenance, tyres, insurance, tax (company vehicle taxes, benefits in kind, non-deductible depreciation), claims and administration. Across a fleet, TCO breaks down into vehicle TCO (75%), driver TCO (20%) and fleet TCO (5%), according to the Observatoire du Véhicule d'Entreprise. Software such as Fleeti automates this calculation from supplier invoices and real telematics data, by vehicle and site.
What are the main levers for reducing fleet TCO?
Four levers account for most achievable savings: energy and fuel (the biggest item, up to 28% of a combustion vehicle's TCO), powertrain choice and ownership period (replacement, targeted electrification), supplier contracts (leases, fuel cards, insurance, maintenance) and driver behaviour (driver TCO is about 20% of the total). A fifth, often overlooked lever is resizing the fleet by removing under-used vehicles, sometimes replaced by mileage allowances or car sharing. Priorities are set vehicle by vehicle from a costed TCO audit, not as a fleet average.
Why does actual TCO differ from theoretical TCO?
Theoretical TCO is calculated before a vehicle is assigned, from list costs, WLTP consumption and standard usage assumptions. Actual TCO includes elements that can only be measured in use: real fuel use, idling time, actual business and personal mileage, observed claims, tyre wear and actual resale value. The gap is commonly 10 to 20% per vehicle, almost always to the company's disadvantage, and comes mostly from driver behaviour. Measuring it requires continuous usage data from on-board telematics, which Fleeti collects automatically from every connected vehicle.
How much does a company vehicle cost per year on average?
According to industry sources, the average TCO of a business vehicle in France is around €10,000 a year, all items included (purchase or lease, energy, maintenance, tax, insurance, claims, administration). This varies widely with powertrain, use and financing. For 2025, the Arval Mobility Observatory puts the average cost per kilometre at €0.476 for a combustion passenger car and €0.423 for its eco-scored electric equivalent. For a fleet of 100 combustion vehicles driving 25,000 km a year, the total cost commonly exceeds €1.2 million a year.
What is the difference between TCO and TCM (Total Cost of Mobility)?
TCO (Total Cost of Ownership) measures the total cost of owning a fleet vehicle, from acquisition to resale. TCM (Total Cost of Mobility) widens the scope to every form of employee mobility: company or pool car, mileage allowance, train, air, taxi, company bike, car sharing and public transport. TCM has become relevant since France introduced the sustainable mobility allowance and business travel options diversified. For a company managing its overall mobility budget, TCO remains the main operational indicator, and TCM the medium-term strategic one.
How does telematics help reduce fleet TCO?
On-board telematics turns TCO from an accounting figure into a management indicator. It continuously reports each vehicle's real fuel use, exact mileage, idling time, trip profile and driving behaviour. Cross-checked with supplier invoices, this data reveals under-used vehicles to remove, drivers to coach, leases to renegotiate on actual mileage, and combustion vehicles whose use justifies switching to electric. Without telematics, TCO is a reported figure built on averages; with it, it becomes actual TCO you can act on vehicle by vehicle. That is Fleeti's approach.
Mis à jour : novembre 2026

What if every euro spent on your fleet went where it delivered the most? Fleeti consolidates your actual costs, measures each vehicle's real use and ranks savings vehicle by vehicle, so you move from enduring TCO to managing it.

What if every euro spent on your fleet went where it delivered the most? Fleeti consolidates your actual costs, measures each vehicle's real use and ranks savings vehicle by vehicle, so you move from enduring TCO to managing it.

Book a demo