
Fleet TCO: manage every cost, vehicle by vehicle
Fleet TCO: manage every cost, vehicle by vehicle
Fleet TCO: manage every cost, vehicle by vehicle
Your fleet's total cost of ownership (TCO) consolidated on a single platform. View by vehicle, site and category. From actual kilometres to accounting exports.
Your fleet's total cost of ownership (TCO) consolidated on a single platform. View by vehicle, site and category. From actual kilometres to accounting exports.
Book a demo

Fleet TCO: manage every cost, vehicle by vehicle
Your fleet's total cost of ownership (TCO) consolidated on a single platform. View by vehicle, site and category. From actual kilometres to accounting exports.
Book a demo
By vehicle, site and category: cost tracking in depth
By vehicle, site and category: cost tracking in depth
By vehicle, site and category: cost tracking in depth
Fleet TCO tracking is only valuable at vehicle level. On a fleet of 200 cars, an average always hides 10 to 15 vehicles whose unit TCO is 30% or more off track. Fleeti reports the TCO of every vehicle and aggregates it by site, category (cars, vans, trucks, machinery) and cost centre.
Fleet TCO tracking is only valuable at vehicle level. On a fleet of 200 cars, an average always hides 10 to 15 vehicles whose unit TCO is 30% or more off track. Fleeti reports the TCO of every vehicle and aggregates it by site, category (cars, vans, trucks, machinery) and cost centre.
Fleet TCO tracking is only valuable at vehicle level. On a fleet of 200 cars, an average always hides 10 to 15 vehicles whose unit TCO is 30% or more off track. Fleeti reports the TCO of every vehicle and aggregates it by site, category (cars, vans, trucks, machinery) and cost centre.
You filter TCO by subsidiary, region, depot, department or type of job. When a driver changes assignment, the history stays with the vehicle and future costs are charged to the new site.
You filter TCO by subsidiary, region, depot, department or type of job. When a driver changes assignment, the history stays with the vehicle and future costs are charged to the new site.
You filter TCO by subsidiary, region, depot, department or type of job. When a driver changes assignment, the history stays with the vehicle and future costs are charged to the new site.
In management meetings, you bring the list of the 15 most expensive vehicles, their cost per kilometre, the gap with the category's median vehicle and the costed replacement scenario. Decisions become fact-based.
In management meetings, you bring the list of the 15 most expensive vehicles, their cost per kilometre, the gap with the category's median vehicle and the costed replacement scenario. Decisions become fact-based.


Cost per km, monthly cost, annual projection: the three key indicators
Cost per km, monthly cost, annual projection: the three key indicators
Cost per km, monthly cost, annual projection: the three key indicators
Three indicators summarise TCO at any given time. Cost per kilometre divides the cumulative cost by the kilometres driven. Monthly cost brings that total down to the payroll cycle. The annual projection extrapolates to 12 and 24 months. Fleeti calculates all three continuously for each vehicle.
Three indicators summarise TCO at any given time. Cost per kilometre divides the cumulative cost by the kilometres driven. Monthly cost brings that total down to the payroll cycle. The annual projection extrapolates to 12 and 24 months. Fleeti calculates all three continuously for each vehicle.
Three indicators summarise TCO at any given time. Cost per kilometre divides the cumulative cost by the kilometres driven. Monthly cost brings that total down to the payroll cycle. The annual projection extrapolates to 12 and 24 months. Fleeti calculates all three continuously for each vehicle.
Cost per kilometre is used to bill internal hire, compare two models with different mileage or charge a job to the right cost centre. Its reliability depends on the source mileage. Fleeti collects mileage through on-board telematics or an OEM connection with no device, and time-stamps it.
Cost per kilometre is used to bill internal hire, compare two models with different mileage or charge a job to the right cost centre. Its reliability depends on the source mileage. Fleeti collects mileage through on-board telematics or an OEM connection with no device, and time-stamps it.
Cost per kilometre is used to bill internal hire, compare two models with different mileage or charge a job to the right cost centre. Its reliability depends on the source mileage. Fleeti collects mileage through on-board telematics or an OEM connection with no device, and time-stamps it.
The annual projection anticipates costs not yet invoiced: upcoming lease payments, the French CO₂ penalty above 113 g/km in 2026, the annual CO₂ emissions tax pro rata to days of ownership, the air pollutant tax based on the Crit'Air sticker, expected return charges, and benefits in kind to include in payroll. You see where the budget is going before it is spent.
The annual projection anticipates costs not yet invoiced: upcoming lease payments, the French CO₂ penalty above 113 g/km in 2026, the annual CO₂ emissions tax pro rata to days of ownership, the air pollutant tax based on the Crit'Air sticker, expected return charges, and benefits in kind to include in payroll. You see where the budget is going before it is spent.
The annual projection anticipates costs not yet invoiced: upcoming lease payments, the French CO₂ penalty above 113 g/km in 2026, the annual CO₂ emissions tax pro rata to days of ownership, the air pollutant tax based on the Crit'Air sticker, expected return charges, and benefits in kind to include in payroll. You see where the budget is going before it is spent.
Multi-supplier consolidation: leasing companies, fuel suppliers, insurers and garages on one platform
Multi-supplier consolidation: leasing companies, fuel suppliers, insurers and garages on one platform
Multi-supplier consolidation: leasing companies, fuel suppliers, insurers and garages on one platform
A fleet generates 5 to 10 invoice streams per vehicle: lease payments, fuel card statements, insurance contracts, garage invoices, tolls and fines. Without consolidation, TCO has to be rebuilt by hand in Excel. Fleeti retrieves these streams through API connectors or automatic invoice import, and aggregates them vehicle by vehicle.
A fleet generates 5 to 10 invoice streams per vehicle: lease payments, fuel card statements, insurance contracts, garage invoices, tolls and fines. Without consolidation, TCO has to be rebuilt by hand in Excel. Fleeti retrieves these streams through API connectors or automatic invoice import, and aggregates them vehicle by vehicle.
A fleet generates 5 to 10 invoice streams per vehicle: lease payments, fuel card statements, insurance contracts, garage invoices, tolls and fines. Without consolidation, TCO has to be rebuilt by hand in Excel. Fleeti retrieves these streams through API connectors or automatic invoice import, and aggregates them vehicle by vehicle.
Native connections with leasing companies Arval, ALD Automotive, Athlon, Leasys and Alphabet, fuel suppliers TotalEnergies, BP and Shell, the DKV hub for multi-brand fuel cards, the main fleet insurers and the Côté Route, First Stop and Speedy networks. For suppliers without a connector, OCR reads the PDF in a second and assigns the cost to the right vehicle using the registration number.
Native connections with leasing companies Arval, ALD Automotive, Athlon, Leasys and Alphabet, fuel suppliers TotalEnergies, BP and Shell, the DKV hub for multi-brand fuel cards, the main fleet insurers and the Côté Route, First Stop and Speedy networks. For suppliers without a connector, OCR reads the PDF in a second and assigns the cost to the right vehicle using the registration number.
Native connections with leasing companies Arval, ALD Automotive, Athlon, Leasys and Alphabet, fuel suppliers TotalEnergies, BP and Shell, the DKV hub for multi-brand fuel cards, the main fleet insurers and the Côté Route, First Stop and Speedy networks. For suppliers without a connector, OCR reads the PDF in a second and assigns the cost to the right vehicle using the registration number.
Your purchasing team goes into renegotiation with actual spend by supplier, the cost of mileage contract amendments, the trend in return charges over 24 months (which can exceed €3,000 per vehicle according to Avrios) and the share of out-of-contract services in maintenance. The balance of power shifts.
Your purchasing team goes into renegotiation with actual spend by supplier, the cost of mileage contract amendments, the trend in return charges over 24 months (which can exceed €3,000 per vehicle according to Avrios) and the share of out-of-contract services in maintenance. The balance of power shifts.

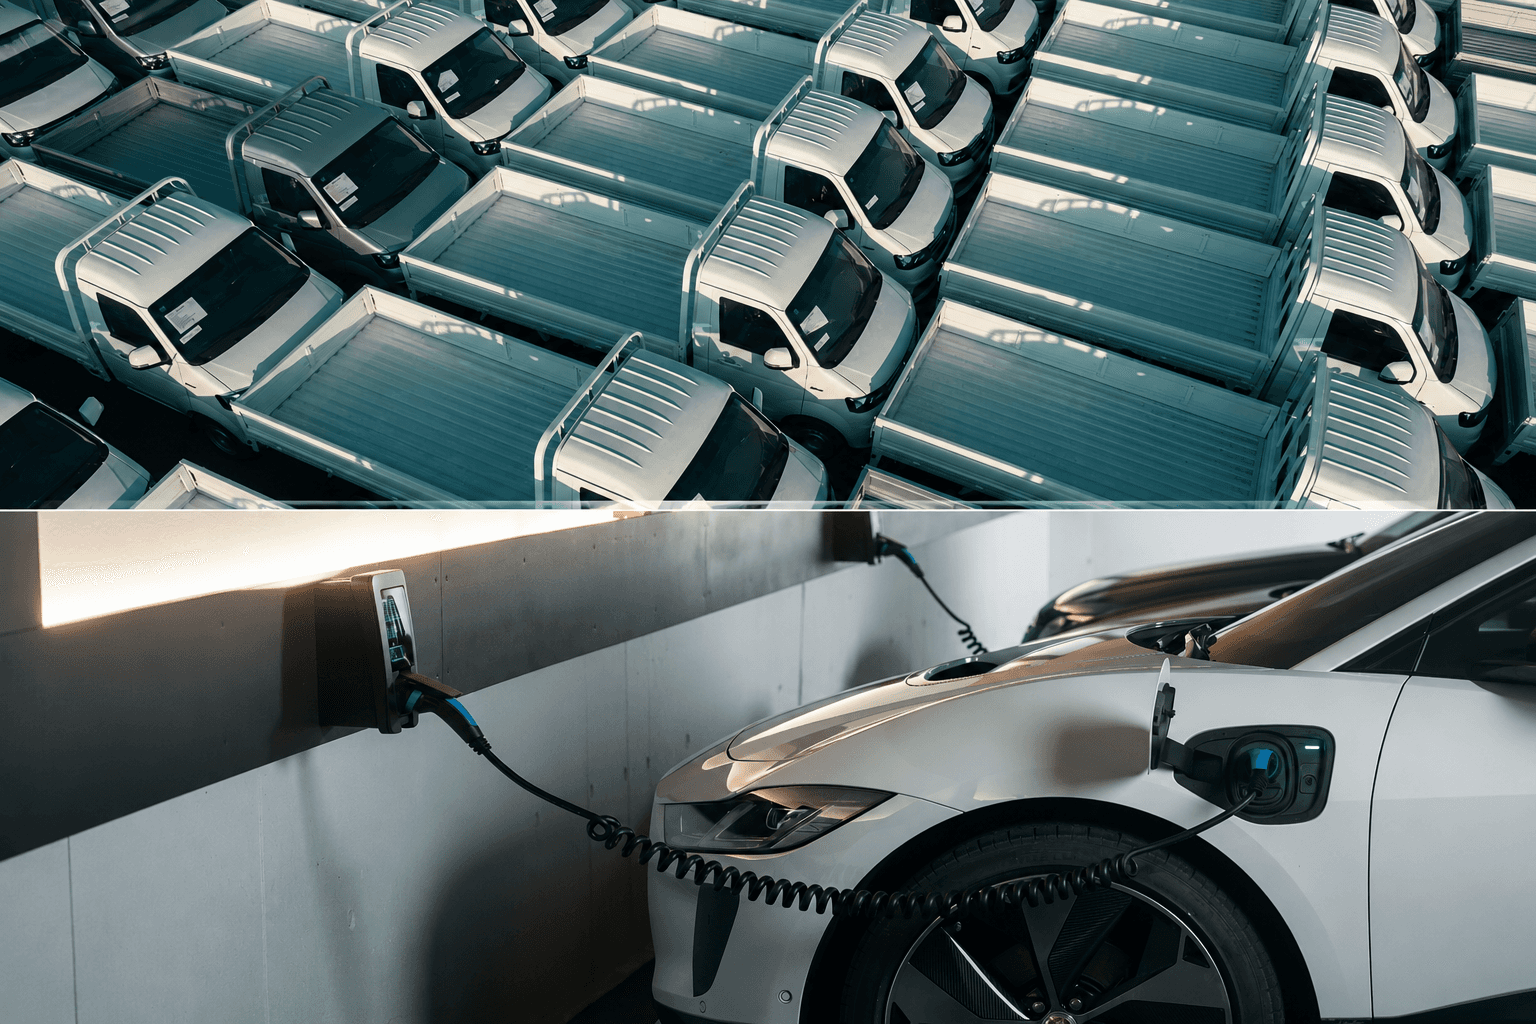
Combustion vs electric TCO: decide on figures, not principles
Combustion vs electric TCO: decide on figures, not principles
Combustion vs electric TCO: decide on figures, not principles
Comparing combustion and electric TCO depends on five variables, not the list price. Over 48 months in 2026, a fully electric compact car eligible for France's ADEME eco-score has a TCO 20 to 35% lower than its combustion equivalent in urban or suburban fleets. The result varies with annual mileage, energy pricing mix, usage profile, 2025-2030 tax rules and return charges.
Comparing combustion and electric TCO depends on five variables, not the list price. Over 48 months in 2026, a fully electric compact car eligible for France's ADEME eco-score has a TCO 20 to 35% lower than its combustion equivalent in urban or suburban fleets. The result varies with annual mileage, energy pricing mix, usage profile, 2025-2030 tax rules and return charges.
Comparing combustion and electric TCO depends on five variables, not the list price. Over 48 months in 2026, a fully electric compact car eligible for France's ADEME eco-score has a TCO 20 to 35% lower than its combustion equivalent in urban or suburban fleets. The result varies with annual mileage, energy pricing mix, usage profile, 2025-2030 tax rules and return charges.
Fleeti compares the TCO of each vehicle with its electric equivalent based on your actual consumption (not catalogue WLTP figures). The calculation includes the 50 to 70% benefit-in-kind allowance for eco-score-eligible EVs (guaranteed until 31 December 2027), 100% VAT recovery on business charging electricity (vs 80% on diesel for passenger cars), the annual CO₂ tax exemption for low-emission vehicles under 50 g/km, and the scrappage bonus.
Fleeti compares the TCO of each vehicle with its electric equivalent based on your actual consumption (not catalogue WLTP figures). The calculation includes the 50 to 70% benefit-in-kind allowance for eco-score-eligible EVs (guaranteed until 31 December 2027), 100% VAT recovery on business charging electricity (vs 80% on diesel for passenger cars), the annual CO₂ tax exemption for low-emission vehicles under 50 g/km, and the scrappage bonus.
Fleeti compares the TCO of each vehicle with its electric equivalent based on your actual consumption (not catalogue WLTP figures). The calculation includes the 50 to 70% benefit-in-kind allowance for eco-score-eligible EVs (guaranteed until 31 December 2027), 100% VAT recovery on business charging electricity (vs 80% on diesel for passenger cars), the annual CO₂ tax exemption for low-emission vehicles under 50 g/km, and the scrappage bonus.
The decision differs for a sales rep driving 35,000 km a year, 60% on motorways, and a technician driving 18,000 km in town. Fleeti cross-checks your telematics data (consumption, trip profiles, possible overnight charging at the driver's home) with the current EV range to suggest compatible models, vehicle by vehicle.
The decision differs for a sales rep driving 35,000 km a year, 60% on motorways, and a technician driving 18,000 km in town. Fleeti cross-checks your telematics data (consumption, trip profiles, possible overnight charging at the driver's home) with the current EV range to suggest compatible models, vehicle by vehicle.
The decision differs for a sales rep driving 35,000 km a year, 60% on motorways, and a technician driving 18,000 km in town. Fleeti cross-checks your telematics data (consumption, trip profiles, possible overnight charging at the driver's home) with the current EV range to suggest compatible models, vehicle by vehicle.
Fleet TCO software: accounting, payroll and DSN exports with no re-entry
Fleet TCO software: accounting, payroll and DSN exports with no re-entry
Fleet TCO software: accounting, payroll and DSN exports with no re-entry
Fleet TCO software is only useful if its data lands in your accounting, payroll and DSN (French payroll declaration) with no re-entry. Fleeti exports entries by cost centre, benefits in kind by payslip and annual taxes in the format your ERP expects. Native connectors for SAP, Cegid, Sage, Workday, Lucca and Silae, plus a generic CSV or API format.
Fleet TCO software is only useful if its data lands in your accounting, payroll and DSN (French payroll declaration) with no re-entry. Fleeti exports entries by cost centre, benefits in kind by payslip and annual taxes in the format your ERP expects. Native connectors for SAP, Cegid, Sage, Workday, Lucca and Silae, plus a generic CSV or API format.
Fleet TCO software is only useful if its data lands in your accounting, payroll and DSN (French payroll declaration) with no re-entry. Fleeti exports entries by cost centre, benefits in kind by payslip and annual taxes in the format your ERP expects. Native connectors for SAP, Cegid, Sage, Workday, Lucca and Silae, plus a generic CSV or API format.
The benefit in kind is calculated vehicle by vehicle, either at the flat rate (15% of the purchase price for combustion vehicles under 5 years old, 50% of the annual lease cost, under the French decree of 25 February 2025) or on an actual-cost basis using measured private mileage. Fleeti automatically selects the more favourable method. On 200 vehicles, the time saved on data entry is 50 to 80 hours a year.
The benefit in kind is calculated vehicle by vehicle, either at the flat rate (15% of the purchase price for combustion vehicles under 5 years old, 50% of the annual lease cost, under the French decree of 25 February 2025) or on an actual-cost basis using measured private mileage. Fleeti automatically selects the more favourable method. On 200 vehicles, the time saved on data entry is 50 to 80 hours a year.
The benefit in kind is calculated vehicle by vehicle, either at the flat rate (15% of the purchase price for combustion vehicles under 5 years old, 50% of the annual lease cost, under the French decree of 25 February 2025) or on an actual-cost basis using measured private mileage. Fleeti automatically selects the more favourable method. On 200 vehicles, the time saved on data entry is 50 to 80 hours a year.
Fleeti allocates TCO by French expense account (lease 612, fuel 6061, maintenance 6155, insurance 616, tax 6354) and by financial year. Non-deductible depreciation is calculated using current caps (€18,300 for combustion passenger cars, €20,300 for EVs) for tax form 2058-A. The DSN gateway sends benefits in kind to payroll in the right month.
Fleeti allocates TCO by French expense account (lease 612, fuel 6061, maintenance 6155, insurance 616, tax 6354) and by financial year. Non-deductible depreciation is calculated using current caps (€18,300 for combustion passenger cars, €20,300 for EVs) for tax form 2058-A. The DSN gateway sends benefits in kind to payroll in the right month.
Fleeti allocates TCO by French expense account (lease 612, fuel 6061, maintenance 6155, insurance 616, tax 6354) and by financial year. Non-deductible depreciation is calculated using current caps (€18,300 for combustion passenger cars, €20,300 for EVs) for tax form 2058-A. The DSN gateway sends benefits in kind to payroll in the right month.

Actual vs self-reported TCO: field data changes the calculation
Actual vs self-reported TCO: field data changes the calculation
Actual vs self-reported TCO: field data changes the calculation
Fleet TCO can be calculated in two opposite ways: self-reported or actual. On a fleet of 200 vehicles, the annual gap can exceed €50,000.
Fleet TCO can be calculated in two opposite ways: self-reported or actual. On a fleet of 200 vehicles, the annual gap can exceed €50,000.
Fleet TCO can be calculated in two opposite ways: self-reported or actual. On a fleet of 200 vehicles, the annual gap can exceed €50,000.
Self-reported TCO works without on-board hardware but depends on how carefully data is entered. A driver who under-reports private use to lower their benefit in kind, a leasing company that reports amendments late, a fuel supplier that invoices late: each creates gaps that stay invisible until the audit.
Self-reported TCO works without on-board hardware but depends on how carefully data is entered. A driver who under-reports private use to lower their benefit in kind, a leasing company that reports amendments late, a fuel supplier that invoices late: each creates gaps that stay invisible until the audit.
Self-reported TCO works without on-board hardware but depends on how carefully data is entered. A driver who under-reports private use to lower their benefit in kind, a leasing company that reports amendments late, a fuel supplier that invoices late: each creates gaps that stay invisible until the audit.
Actual TCO reads mileage from the vehicle's CAN bus (telematics device) or through the OEM manufacturer connection with no device. Consumption is measured, not estimated from catalogue WLTP figures. Private and business use are separated automatically by timestamp. Actual-cost taxation and electrification decisions rely on observed figures.
Actual TCO reads mileage from the vehicle's CAN bus (telematics device) or through the OEM manufacturer connection with no device. Consumption is measured, not estimated from catalogue WLTP figures. Private and business use are separated automatically by timestamp. Actual-cost taxation and electrification decisions rely on observed figures.
Actual TCO reads mileage from the vehicle's CAN bus (telematics device) or through the OEM manufacturer connection with no device. Consumption is measured, not estimated from catalogue WLTP figures. Private and business use are separated automatically by timestamp. Actual-cost taxation and electrification decisions rely on observed figures.
Fleeti combines both approaches on a single platform. Supplier invoices are imported by OCR or API (leasing companies Arval, ALD, Athlon, Leasys; fuel suppliers TotalEnergies, BP, Shell; the DKV hub; insurers; garages). Mileage and consumption come from on-board telematics or a device-free OEM connection. The resulting consolidated TCO stands up to an URSSAF audit, a tax inspection and investment decisions you can defend in committee.
Fleeti combines both approaches on a single platform. Supplier invoices are imported by OCR or API (leasing companies Arval, ALD, Athlon, Leasys; fuel suppliers TotalEnergies, BP, Shell; the DKV hub; insurers; garages). Mileage and consumption come from on-board telematics or a device-free OEM connection. The resulting consolidated TCO stands up to an URSSAF audit, a tax inspection and investment decisions you can defend in committee.
Book a demo
Cost tracking with Fleeti, in figures
Cost tracking with Fleeti, in figures
Cost tracking with Fleeti, in figures

35 %
35 %
35 %
Potential annual TCO saving of a fully electric eco-score-eligible compact car vs its combustion equivalent in 2026 (Avrios, over 48 months)
Potential annual TCO saving of a fully electric eco-score-eligible compact car vs its combustion equivalent in 2026 (Avrios, over 48 months)
5
5
5
Cost items consolidated on a single platform: lease or depreciation, fuel, maintenance, insurance, tax.
Cost items consolidated on a single platform: lease or depreciation, fuel, maintenance, insurance, tax.
Cost items consolidated on a single platform: lease or depreciation, fuel, maintenance, insurance, tax.
0
0
0
Manual mileage entries. Field data comes through on-board telematics or a device-free OEM manufacturer connection
Manual mileage entries. Field data comes through on-board telematics or a device-free OEM manufacturer connection
Manual mileage entries. Field data comes through on-board telematics or a device-free OEM manufacturer connection
Calculate your fleet TCO savings in 2 minutes
Before switching to Fleeti, measure the gain. The calculator compares your fleet's current TCO with an optimised scenario (actual consumption, 2025-2026 tax rules, targeted electrification) and quantifies the saving for 1 to 500 vehicles. No account needed, instant results.
TCO trends 2025-2030: 5 turning points to build into your car policy
Fleet TCO is not stable. Five tax and regulatory turning points in France between 2025 and 2030 change a vehicle's cost depending on its powertrain. Plan your replacements with this timeline.
2025
Fleet tax reform
The company vehicle tax (TVS) was abolished on 1 January and replaced by the annual CO₂ emissions tax (WLTP scale) and the air pollutant tax (Crit'Air sticker). Decree of 25 February 2025 on benefits in kind: combustion rate raised from 9 to 15% of the purchase price, and from 30 to 50% of the annual lease cost. 50 to 70% allowance for eco-score-eligible EVs.
2026
Tougher penalties
CO₂ penalty threshold lowered to 113 g/km, capped at €70,000. Weight penalty extended to vehicles over 1,600 kg, hybrids included. Incentive tax (TAI) of €4,000 per missing vehicle (fleets of more than 100 cars). LOM quota of 18% low-emission vehicles.
2027
Pressure on combustion vehicles
TAI of €5,000 per missing vehicle. LOM quota of 25% low-emission vehicles. Electric benefit-in-kind allowance (50 to 70%) guaranteed until 31 December. Non-deductible depreciation caps recalculated for high-emission powertrains.
2028
Gradual phase-out
Benefit-in-kind rules for EVs expected to be recalibrated after 2027. Plan to renegotiate leases signed in 2024-2025, whose residual values no longer reflect combustion depreciation. Large-scale used EV market.
2030
Final LOM target
LOM quota of 70% low-emission vehicles in replacements (Climate and Resilience Law). The TCO of a non-electrified fleet includes a structural TAI, the annual penalty and the difficulty of reselling combustion vehicles. Early movers gain a competitive edge.
The 5 cost items in fleet TCO
According to the Observatoire du Véhicule d'Entreprise (OVE), fleet TCO breaks down into three levels: 75% vehicle (the 5 items below), 20% driver (accidents, overconsumption, eco-driving) and 5% fleet management (admin costs). Fleeti on-board telematics acts on all three: real data for vehicle TCO, deviation detection for driver TCO, and automation for fleet TCO.
Lease or depreciation
Lease or depreciation
Lease or depreciation
≈ 40% of TCO. Lever: vehicle choice (powertrain, residual value), ownership period, financing method (contract hire, lease with purchase option, purchase). Fleeti compares leasing offers and predicted residual value to optimise the term/mileage combination.
Fuel or energy
≈ 25% of TCO according to the OVE. Lever: eco-driving, route optimisation, electrification. Fleeti tracks actual consumption and quantifies the saving from switching to electric for each vehicle.
Maintenance and tyres
≈ 10 to 15% of TCO. Lever: preventive maintenance, negotiated network packages, tyre tracking. Fleeti triggers servicing at actual mileage and anticipates lease return charges (up to €3,000 per vehicle).
Insurance and claims
≈ 10% of TCO. Sharp rise in 2025 for EVs after the end of the partial TSCA (French insurance tax) exemption. Lever: claims analysis by driver, eco-driving training, telematics for digital accident reports.
Tax
≈ 10% of TCO. Annual company vehicle taxes (formerly TVS), CO₂ penalty, weight penalty, non-deductible depreciation, benefits in kind. Lever: optimisation by vehicle under the WLTP scale. Fleeti calculates pro rata to days of ownership and adjusts for the tax return.
These five items share the same source data: actual mileage, powertrain, usage dates, supplier invoices and driver assignment. Fleeti collects this data automatically (on-board telematics or OEM connection) and allocates it to the right accounts, with timestamps and a retained history.
A platform for every decision-maker involved in cost tracking
Cost tracking involves several functions. Finance, management control and purchasing each need a different view of the same data. Fleeti gives each of them the right indicators and exports.
Finance department
For a finance department managing 100 to 500 vehicles, Fleeti centralises consolidated TCO by site, category and cost centre. Annual projection, budget vs actual comparison, export to accounting consolidation, automatic calculation of annual taxes and non-deductible depreciation. Electrification decisions rest on figures you can defend before the management committee.
For a finance department managing 100 to 500 vehicles, Fleeti centralises consolidated TCO by site, category and cost centre. Annual projection, budget vs actual comparison, export to accounting consolidation, automatic calculation of annual taxes and non-deductible depreciation. Electrification decisions rest on figures you can defend before the management committee.
Management control
Fleeti provides continuously updated cost per kilometre and monthly cost per vehicle. Automatic detection of overruns: excess mileage against the contract, overconsumption, abnormal claims, out-of-contract charges from the leasing company. The gap between forecast and actual TCO becomes visible immediately, not at year-end.
Fleeti provides continuously updated cost per kilometre and monthly cost per vehicle. Automatic detection of overruns: excess mileage against the contract, overconsumption, abnormal claims, out-of-contract charges from the leasing company. The gap between forecast and actual TCO becomes visible immediately, not at year-end.
Fleeti provides continuously updated cost per kilometre and monthly cost per vehicle. Automatic detection of overruns: excess mileage against the contract, overconsumption, abnormal claims, out-of-contract charges from the leasing company. The gap between forecast and actual TCO becomes visible immediately, not at year-end.
Purchasing department
To negotiate with leasing companies, fuel suppliers and fleet insurers, Fleeti provides a consolidated view of spend by supplier, analysis of lease contract flexibility, tracking of expected return charges and comparison of price grids. You renegotiate with your own data, not an industry average.
To negotiate with leasing companies, fuel suppliers and fleet insurers, Fleeti provides a consolidated view of spend by supplier, analysis of lease contract flexibility, tracking of expected return charges and comparison of price grids. You renegotiate with your own data, not an industry average.
To negotiate with leasing companies, fuel suppliers and fleet insurers, Fleeti provides a consolidated view of spend by supplier, analysis of lease contract flexibility, tracking of expected return charges and comparison of price grids. You renegotiate with your own data, not an industry average.
Frequently asked questions about fleet TCO and cost tracking
Take back control of your fleet TCO. Fleeti consolidates acquisition, fuel, maintenance, insurance and tax on a single platform fed by field data. From actual kilometres to accounting exports.
Take back control of your fleet TCO. Fleeti consolidates acquisition, fuel, maintenance, insurance and tax on a single platform fed by field data. From actual kilometres to accounting exports.



IoT for the operations of African and European businesses.
© 2026 Fleeti SAS