
Cut your business fuel costs by up to 25%
Cut your business fuel costs by up to 25%
Cut your business fuel costs by up to 25%
Fuel accounts for 20 to 40% of a fleet's operating budget. Fleeti combines theft detection, eco-driving, route optimisation and fuel card cross-checks to bring this bill down measurably. The same platform covers your vehicles and machinery, in Europe and Africa.
Fuel accounts for 20 to 40% of a fleet's operating budget. Fleeti combines theft detection, eco-driving, route optimisation and fuel card cross-checks to bring this bill down measurably. The same platform covers your vehicles and machinery, in Europe and Africa.
Book a demo

Cut your business fuel costs by up to 25%
Fuel accounts for 20 to 40% of a fleet's operating budget. Fleeti combines theft detection, eco-driving, route optimisation and fuel card cross-checks to bring this bill down measurably. The same platform covers your vehicles and machinery, in Europe and Africa.
Book a demo
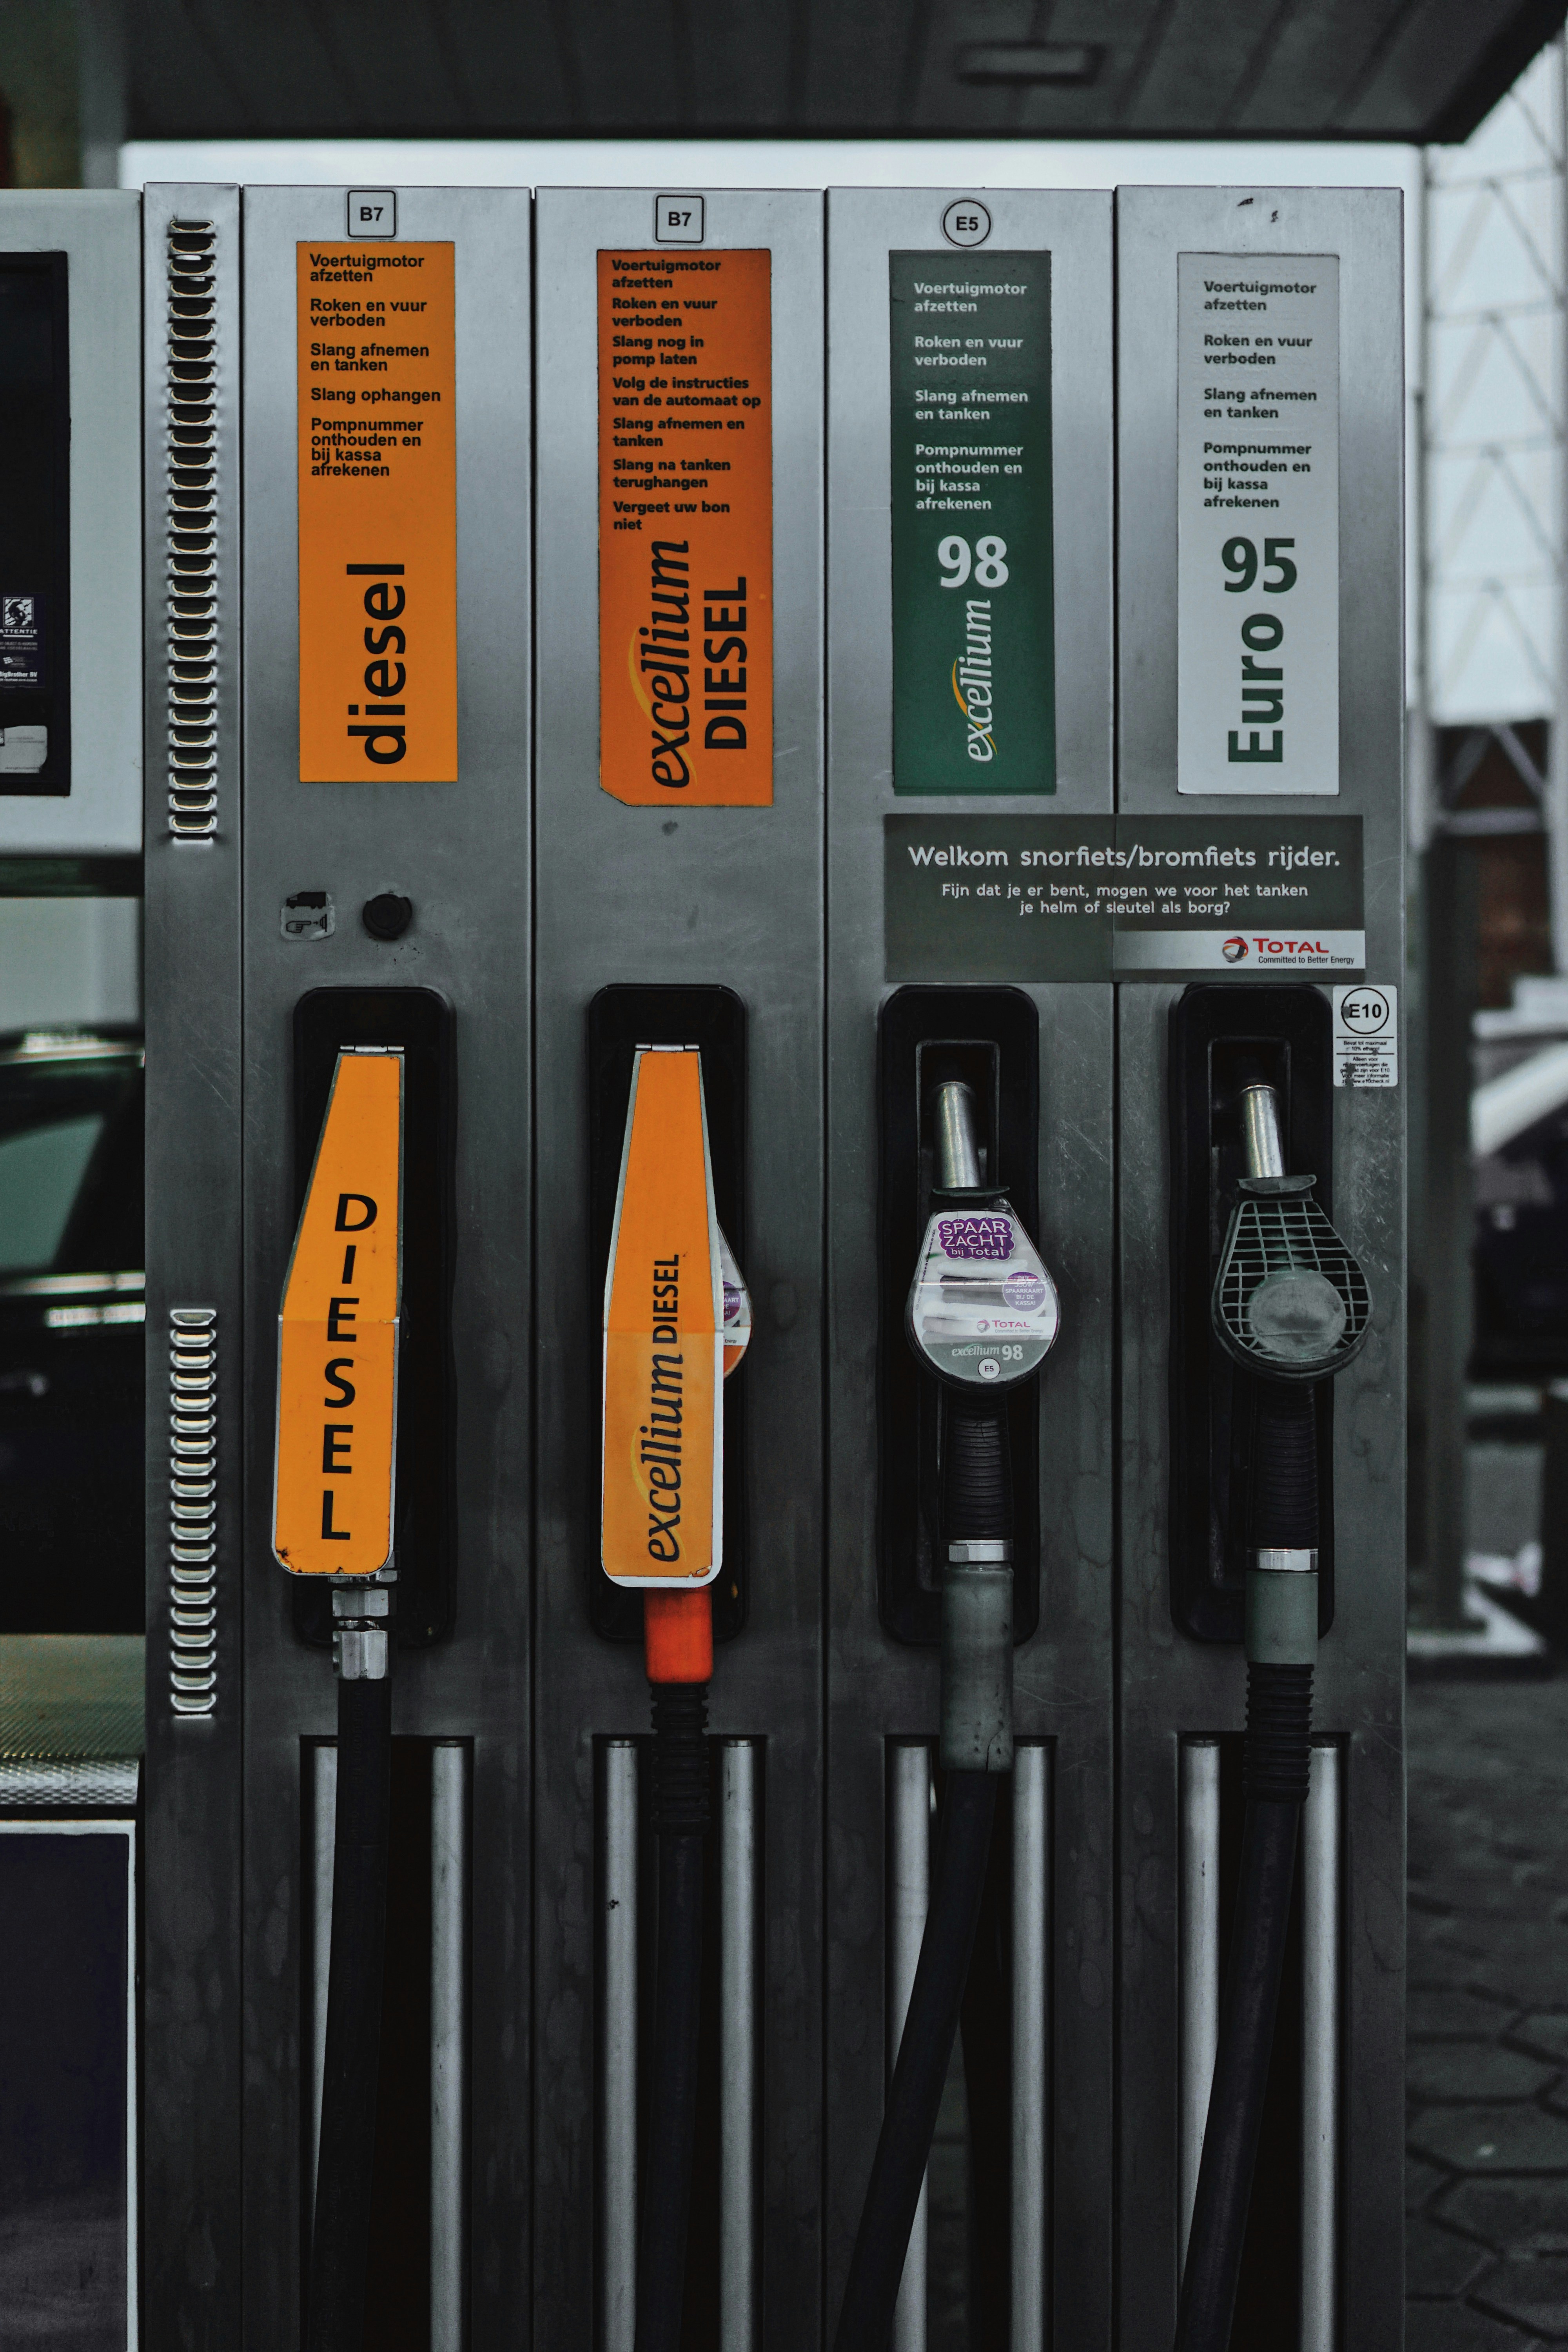
Detect fuel theft and fraud immediately
Detect fuel theft and fraud immediately
Detect fuel theft and fraud immediately
Fuel misappropriation is often a fleet's most invisible loss. Tank siphoning, double billing at the pump, off-site transactions: these leaks go unnoticed with self-reported tracking.
Fuel misappropriation is often a fleet's most invisible loss. Tank siphoning, double billing at the pump, off-site transactions: these leaks go unnoticed with self-reported tracking.
Fleeti cross-checks a physical tank probe and CAN bus readings with real-time alerts on abnormal level drops. Every gap between fuel paid for and fuel actually in the tank triggers an immediate notification.
Fleeti cross-checks a physical tank probe and CAN bus readings with real-time alerts on abnormal level drops. Every gap between fuel paid for and fuel actually in the tank triggers an immediate notification.
The approach works on a van in France as well as on construction machinery in Senegal. That is what sets Fleeti apart from simply reading fuel transactions in the accounts.
The approach works on a van in France as well as on construction machinery in Senegal. That is what sets Fleeti apart from simply reading fuel transactions in the accounts.
Cut fuel use through eco-driving
Cut fuel use through eco-driving
Cut fuel use through eco-driving
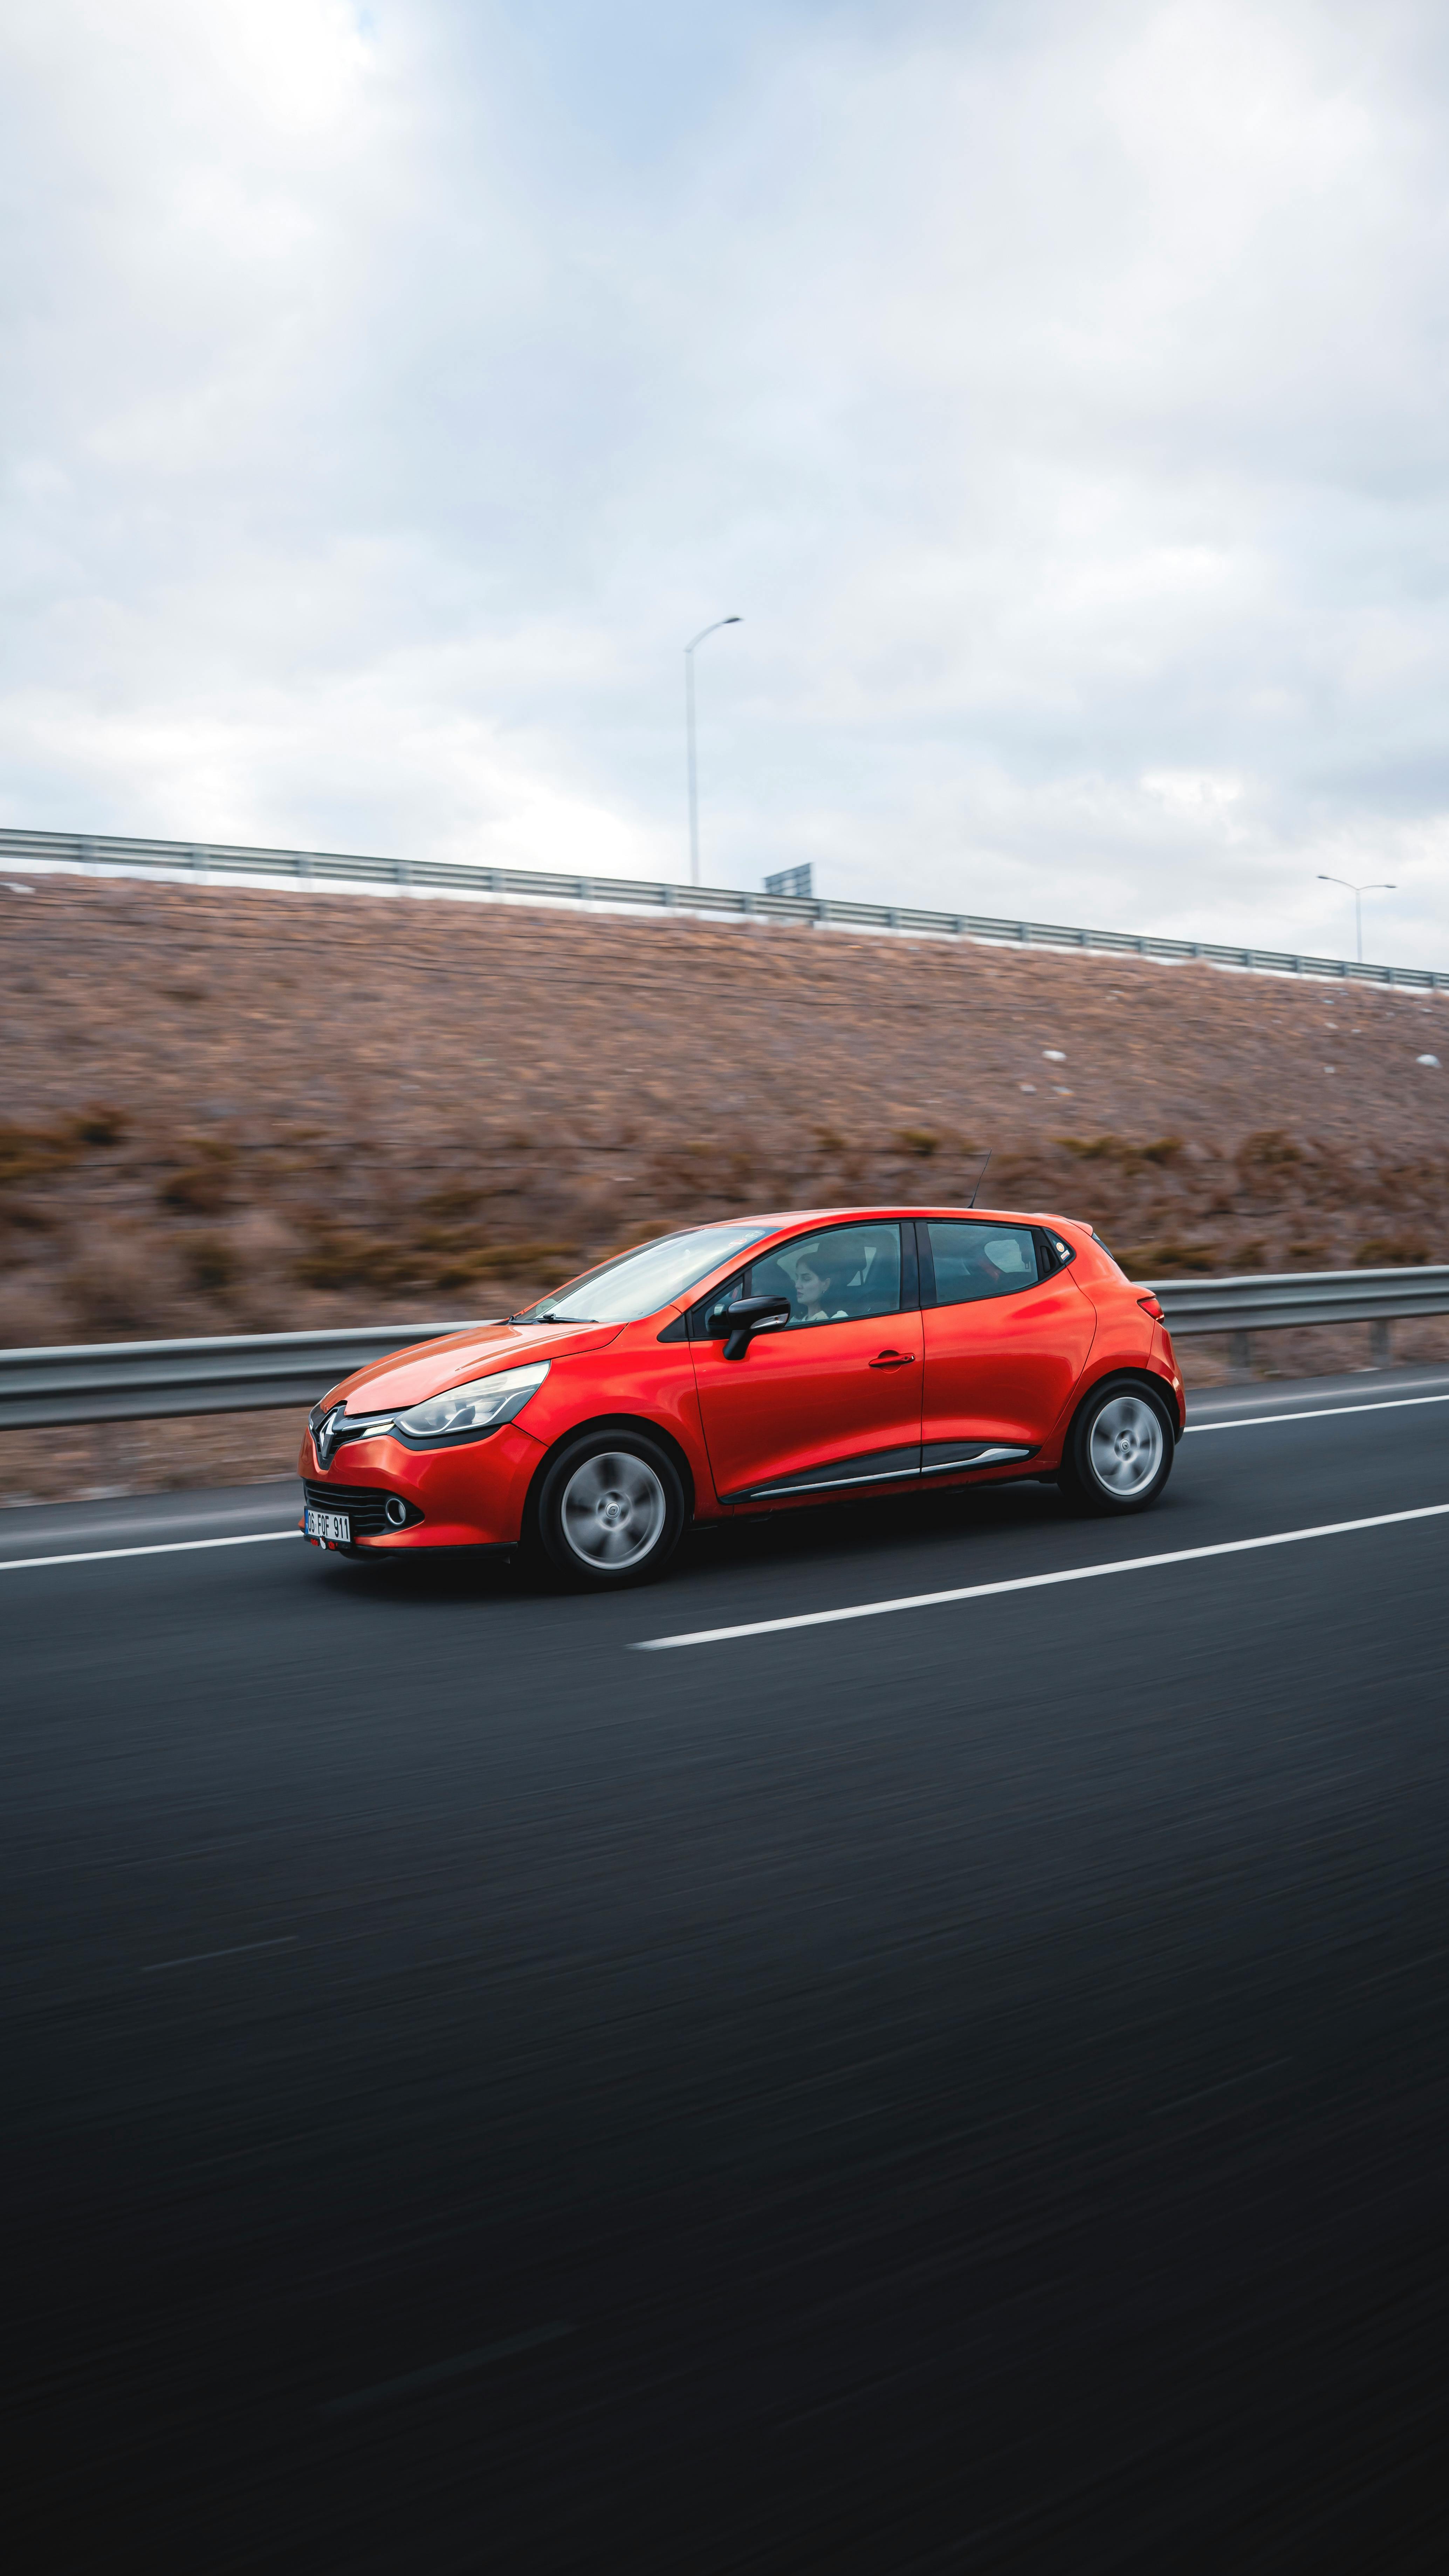
Driver behaviour accounts for 10 to 20% of a fleet's actual fuel consumption. Harsh acceleration, late braking, speeding and wrong gears waste litres on every trip.
Driver behaviour accounts for 10 to 20% of a fleet's actual fuel consumption. Harsh acceleration, late braking, speeding and wrong gears waste litres on every trip.
The eco-driving module in Fleeti gives each driver a score based on these criteria, produces monthly reports and lets you coach the drivers with the most room for improvement. Savings can be measured from the second month.
The eco-driving module in Fleeti gives each driver a score based on these criteria, produces monthly reports and lets you coach the drivers with the most room for improvement. Savings can be measured from the second month.
On a fleet of 200 light vehicles, eco-driving alone can save tens of thousands of euros a year, with no extra hardware investment.
On a fleet of 200 light vehicles, eco-driving alone can save tens of thousands of euros a year, with no extra hardware investment.
Cut idling and unnecessary kilometres
Cut idling and unnecessary kilometres
Cut idling and unnecessary kilometres
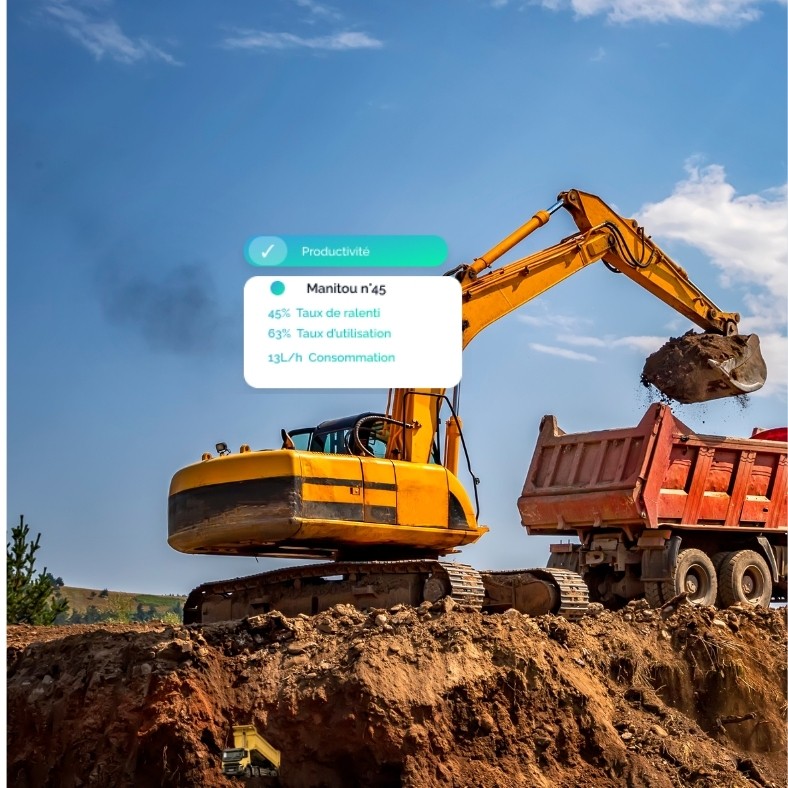
An hour of idling burns one to two litres of fuel for nothing. On construction machinery and service vehicles, engines running needlessly waste several litres per asset per day.
An hour of idling burns one to two litres of fuel for nothing. On construction machinery and service vehicles, engines running needlessly waste several litres per asset per day.
Fleeti automatically detects excessive idling, unproductive trips and unjustified detours. Alerts reach fleet managers without waiting for month-end.
Fleeti automatically detects excessive idling, unproductive trips and unjustified detours. Alerts reach fleet managers without waiting for month-end.
Reviewing rounds afterwards lets you adjust recurring routes and cut unnecessary kilometres. It is one of the fastest levers to pull.
Reviewing rounds afterwards lets you adjust recurring routes and cut unnecessary kilometres. It is one of the fastest levers to pull.
Cross-check your fuel cards against actual consumption
Cross-check your fuel cards against actual consumption
Cross-check your fuel cards against actual consumption
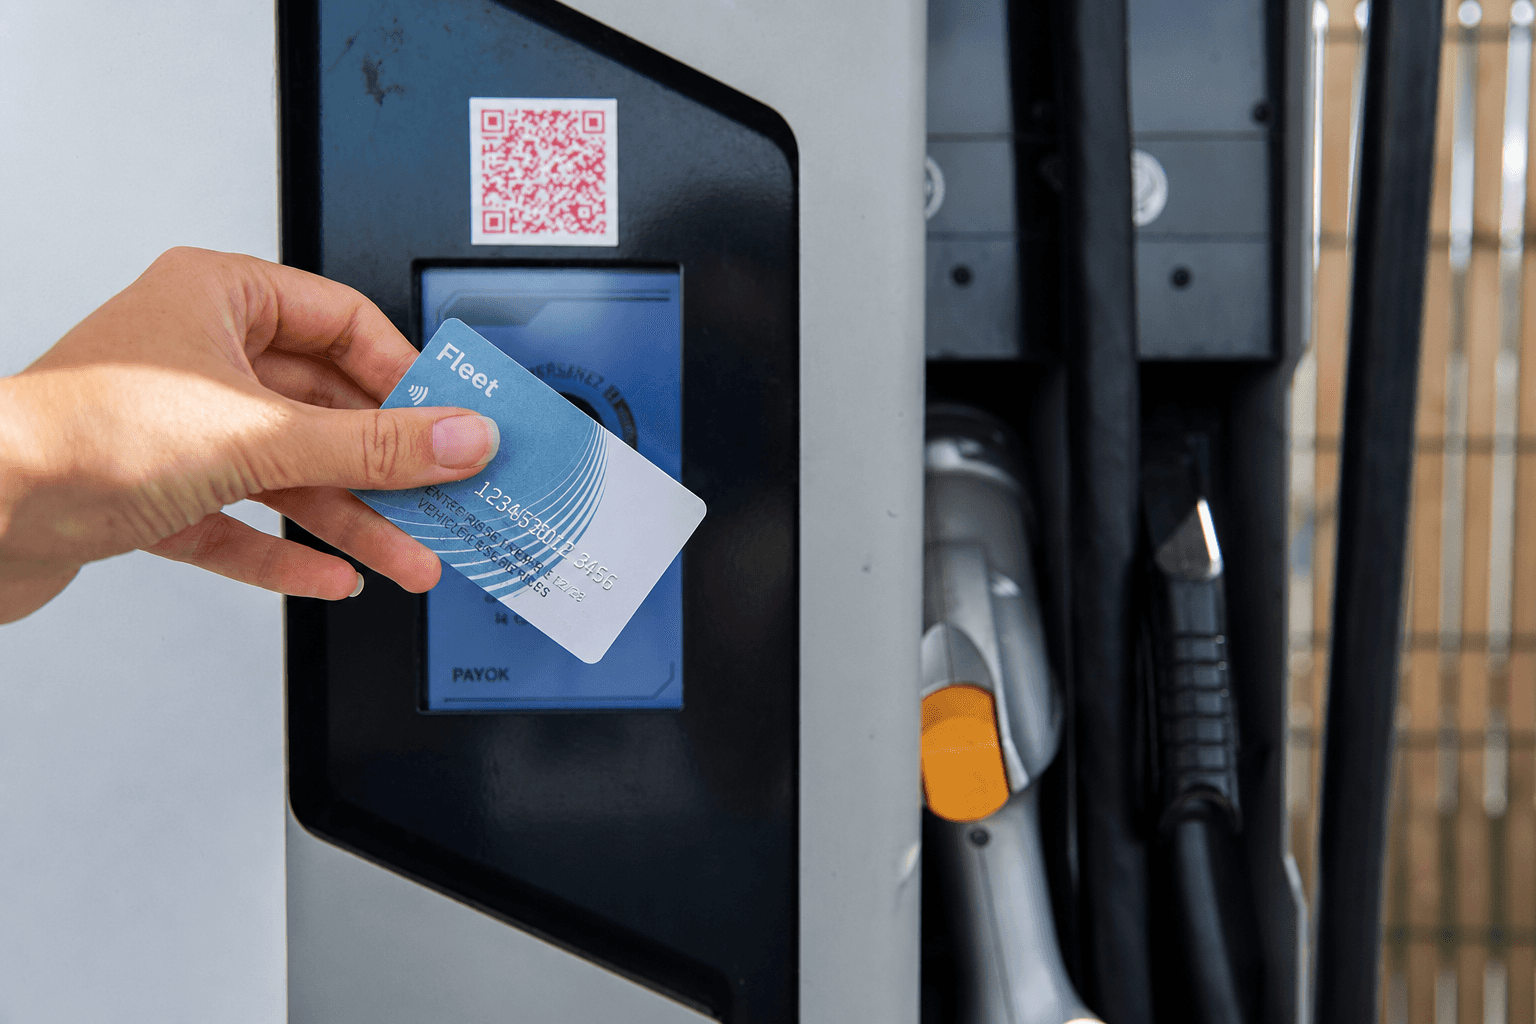
A fuel card tells you what was paid at the pump. It does not tell you what reached the tank. That gap is the blind spot of purely financial solutions.
A fuel card tells you what was paid at the pump. It does not tell you what reached the tank. That gap is the blind spot of purely financial solutions.
Fleeti automatically matches each fuel card transaction with the vehicle's position, mileage driven and tank level before and after refuelling. Anomalies are reported in real time.
Fleeti automatically matches each fuel card transaction with the vehicle's position, mileage driven and tank level before and after refuelling. Anomalies are reported in real time.
The integration works with the main fuel cards on the market. You keep your supplier contracts and gain the level of control they were missing.
The integration works with the main fuel cards on the market. You keep your supplier contracts and gain the level of control they were missing.
Book a demo
What telematics changes for a fleet's fuel budget
What telematics changes for a fleet's fuel budget
What telematics changes for a fleet's fuel budget

15 to 25%
15 to 25%
15 to 25%
The range of fuel budget savings seen by fleets with a full telematics solution. A Frost & Sullivan study puts the upper end at 25% on average.
The range of fuel budget savings seen by fleets with a full telematics solution. A Frost & Sullivan study puts the upper end at 25% on average.
20 to 40%
20 to 40%
20 to 40%
The share of the operating budget accounted for by fuel in transport fleets, technical services or construction. Persistently high pump prices make this cost structurally volatile.
The share of the operating budget accounted for by fuel in transport fleets, technical services or construction. Persistently high pump prices make this cost structurally volatile.
The share of the operating budget accounted for by fuel in transport fleets, technical services or construction. Persistently high pump prices make this cost structurally volatile.
1 to 2 litres
1 to 2 litres
1 to 2 litres
What an hour of idling burns, depending on vehicle size. On a fleet of 50 vans idling 30 minutes a day each, that adds up to several thousand litres lost every year.
What an hour of idling burns, depending on vehicle size. On a fleet of 50 vans idling 30 minutes a day each, that adds up to several thousand litres lost every year.
What an hour of idling burns, depending on vehicle size. On a fleet of 50 vans idling 30 minutes a day each, that adds up to several thousand litres lost every year.
The 4 fuel savings levers to activate first
Cutting a fleet's fuel bill for good depends on four levers used together rather than a single tool. Each produces measurable savings, and together they reach the 15 to 25% range.
01
01
Theft and siphoning
Theft and siphoning
Theft and siphoning
Physical tank probe, abnormal drop alerts and refuel location tracking. Typical impact: 3 to 10% of the fuel budget recovered on exposed fleets. A priority lever in construction and at remote sites.
Physical tank probe, abnormal drop alerts and refuel location tracking. Typical impact: 3 to 10% of the fuel budget recovered on exposed fleets. A priority lever in construction and at remote sites.
Physical tank probe, abnormal drop alerts and refuel location tracking. Typical impact: 3 to 10% of the fuel budget recovered on exposed fleets. A priority lever in construction and at remote sites.
Physical tank probe, abnormal drop alerts and refuel location tracking. Typical impact: 3 to 10% of the fuel budget recovered on exposed fleets. A priority lever in construction and at remote sites.
02
02
Eco-driving
Eco-driving
Eco-driving
Driver score, monthly reports and coaching for at-risk drivers. Typical impact: 10 to 20% lower consumption. A universal lever for car and van fleets.
Driver score, monthly reports and coaching for at-risk drivers. Typical impact: 10 to 20% lower consumption. A universal lever for car and van fleets.
Driver score, monthly reports and coaching for at-risk drivers. Typical impact: 10 to 20% lower consumption. A universal lever for car and van fleets.
Driver score, monthly reports and coaching for at-risk drivers. Typical impact: 10 to 20% lower consumption. A universal lever for car and van fleets.
03
03
Idling and unnecessary kilometres
Idling and unnecessary kilometres
Idling and unnecessary kilometres
Excessive idling detection, round analysis and unjustified detour alerts. Typical impact: 5 to 15% fuel saved. A decisive lever for construction machinery and mobile technicians.
Excessive idling detection, round analysis and unjustified detour alerts. Typical impact: 5 to 15% fuel saved. A decisive lever for construction machinery and mobile technicians.
Excessive idling detection, round analysis and unjustified detour alerts. Typical impact: 5 to 15% fuel saved. A decisive lever for construction machinery and mobile technicians.
Excessive idling detection, round analysis and unjustified detour alerts. Typical impact: 5 to 15% fuel saved. A decisive lever for construction machinery and mobile technicians.
04
04
Fuel card cross-checks
Fuel card cross-checks
Fuel card cross-checks
Automatic matching of card transactions with vehicle position and tank level. Typical impact: 2 to 5% pump fraud detected. A complement to any telematics solution.
Automatic matching of card transactions with vehicle position and tank level. Typical impact: 2 to 5% pump fraud detected. A complement to any telematics solution.
Automatic matching of card transactions with vehicle position and tank level. Typical impact: 2 to 5% pump fraud detected. A complement to any telematics solution.
Automatic matching of card transactions with vehicle position and tank level. Typical impact: 2 to 5% pump fraud detected. A complement to any telematics solution.
A 3-step method to take action
Activating these four levers does not take a twelve-month vendor project. Fleeti's fuel budget optimisation method structures the rollout in three controlled steps, from initial assessment to ongoing management.
01 Assessment
01 Assessment
01 Assessment
A 30-day audit of your fleet. Collection of existing fuel data, review of telematics equipment and identification of the three priority levers for your business. Outcome: a quantified baseline and a targeted action plan.
A 30-day audit of your fleet. Collection of existing fuel data, review of telematics equipment and identification of the three priority levers for your business. Outcome: a quantified baseline and a targeted action plan.
A 30-day audit of your fleet. Collection of existing fuel data, review of telematics equipment and identification of the three priority levers for your business. Outcome: a quantified baseline and a targeted action plan.
02 Activation
02 Activation
02 Activation
Device rollout and platform configuration over 60 days. Theft and idling alerts set up, eco-driving score introduced and fuel cards integrated. First coaching for drivers with the most room for improvement.
Device rollout and platform configuration over 60 days. Theft and idling alerts set up, eco-driving score introduced and fuel cards integrated. First coaching for drivers with the most room for improvement.
Device rollout and platform configuration over 60 days. Theft and idling alerts set up, eco-driving score introduced and fuel cards integrated. First coaching for drivers with the most room for improvement.
03 Ongoing management
03 Ongoing management
03 Ongoing management
Monthly reviews with your Fleeti contact. Tracking of key KPIs: litres per 100 km, idling percentage, driver score, pump vs tank gaps. Targeted adjustments. Savings show from the second quarter.
Monthly reviews with your Fleeti contact. Tracking of key KPIs: litres per 100 km, idling percentage, driver score, pump vs tank gaps. Targeted adjustments. Savings show from the second quarter.
Monthly reviews with your Fleeti contact. Tracking of key KPIs: litres per 100 km, idling percentage, driver score, pump vs tank gaps. Targeted adjustments. Savings show from the second quarter.
How Fleeti cross-checks data to manage the fuel bill
Reducing a fuel bill means measuring the right indicator. Fleeti cross-checks four independent data sources to produce a reliable view that is hard to get around. That is what sets Fleeti apart from purely accounting-based or purely CAN bus solutions.
CAN bus
CAN bus
CAN bus
The vehicle's CAN bus provides consumption as reported by the on-board computer. Accurate on recent vehicles, more limited on construction machinery and mixed fleets.
The vehicle's CAN bus provides consumption as reported by the on-board computer. Accurate on recent vehicles, more limited on construction machinery and mixed fleets.
The vehicle's CAN bus provides consumption as reported by the on-board computer. Accurate on recent vehicles, more limited on construction machinery and mixed fleets.
Physical probe
Physical probe
Physical probe
The probe measures the fuel actually in the tank. It detects siphoning where the CAN bus sees nothing. A long-standing Fleeti strength, built on experience with theft-exposed fleets in Africa.
The probe measures the fuel actually in the tank. It detects siphoning where the CAN bus sees nothing. A long-standing Fleeti strength, built on experience with theft-exposed fleets in Africa.
The probe measures the fuel actually in the tank. It detects siphoning where the CAN bus sees nothing. A long-standing Fleeti strength, built on experience with theft-exposed fleets in Africa.
Driver-reported data
Driver-reported data
Driver-reported data
The mobile app collects refuels reported by drivers on vehicles without a device. Fleeti accepts this source but never relies on it alone.
The mobile app collects refuels reported by drivers on vehicles without a device. Fleeti accepts this source but never relies on it alone.
The mobile app collects refuels reported by drivers on vehicles without a device. Fleeti accepts this source but never relies on it alone.
Fuel cards
Fuel cards
Fuel cards
Automatic matching with fuel card transactions detects gaps between the fuel paid for and the fuel that reached the tank.
Automatic matching with fuel card transactions detects gaps between the fuel paid for and the fuel that reached the tank.
Automatic matching with fuel card transactions detects gaps between the fuel paid for and the fuel that reached the tank.
Litres per 100 km
Litres per 100 km
Litres per 100 km
The standard reference indicator, comparable across vehicles, sites and drivers. It is the first metric to make reliable when building a quantified baseline.
The standard reference indicator, comparable across vehicles, sites and drivers. It is the first metric to make reliable when building a quantified baseline.
The standard reference indicator, comparable across vehicles, sites and drivers. It is the first metric to make reliable when building a quantified baseline.
Idling percentage
Idling percentage
Idling percentage
Unproductive engine running time as a share of total engine time. A healthy target is below 15%. A quick win on construction machinery and service vehicles.
Unproductive engine running time as a share of total engine time. A healthy target is below 15%. A quick win on construction machinery and service vehicles.
Unproductive engine running time as a share of total engine time. A healthy target is below 15%. A quick win on construction machinery and service vehicles.
Driver score
Driver score
Driver score
Composite eco-driving score covering acceleration, braking, speed and anticipation. The basis for monthly coaching and individual driver bonuses.
Composite eco-driving score covering acceleration, braking, speed and anticipation. The basis for monthly coaching and individual driver bonuses.
Composite eco-driving score covering acceleration, braking, speed and anticipation. The basis for monthly coaching and individual driver bonuses.
Pump vs tank gap
Pump vs tank gap
Pump vs tank gap
Difference between fuel paid for by card and fuel entering the tank as measured by a probe. A direct sign of pump fraud or siphoning, usable from the first week.
Difference between fuel paid for by card and fuel entering the tank as measured by a probe. A direct sign of pump fraud or siphoning, usable from the first week.
Difference between fuel paid for by card and fuel entering the tank as measured by a probe. A direct sign of pump fraud or siphoning, usable from the first week.
Why the Europe and Africa perspective changes the fuel picture
A fleet operating on both continents faces very different fuel issues from one country to the next. Fleeti handles these four families of issues natively, with no separate platform or manual consolidated reporting.
Theft and siphoning in Africa
Theft and siphoning in Africa
On construction sites and remote industrial sites in West Africa, diesel siphoning remains one of the leading causes of asset loss. An organised parallel market, inside involvement and unguarded sites: Fleeti's physical probe and night-time alerts form an anti-siphoning solution designed for this context, including on parked trucks and machinery.
On construction sites and remote industrial sites in West Africa, diesel siphoning remains one of the leading causes of asset loss. An organised parallel market, inside involvement and unguarded sites: Fleeti's physical probe and night-time alerts form an anti-siphoning solution designed for this context, including on parked trucks and machinery.
Off-road diesel and mobile tanks
Off-road diesel and mobile tanks
Off-road diesel powers machinery in construction and agriculture. Fleeti tracks refills and consumption on equipped machines, detects gaps against delivery notes and alerts you to level drops outside working hours.
Off-road diesel powers machinery in construction and agriculture. Fleeti tracks refills and consumption on equipped machines, detects gaps against delivery notes and alerts you to level drops outside working hours.
TCO and compliance in France
TCO and compliance in France
In France, fuel is part of overall TCO, CSRD obligations for large accounts and the framework set by the LOM law. Fleeti consolidates cost per km, breaks it down by vehicle and site, feeds Scope 1 and Scope 3 carbon reporting, and complements ANTAI designation for incidents linked to business travel.
In France, fuel is part of overall TCO, CSRD obligations for large accounts and the framework set by the LOM law. Fleeti consolidates cost per km, breaks it down by vehicle and site, feeds Scope 1 and Scope 3 carbon reporting, and complements ANTAI designation for incidents linked to business travel.
Local and multi-currency fuel cards
Local and multi-currency fuel cards
Fuel cards do not work in every African country and contracts vary. Fleeti integrates the main providers in Europe and supports the rollout of suitable solutions in countries where fuel cards are less established.
Fuel cards do not work in every African country and contracts vary. Fleeti integrates the main providers in Europe and supports the rollout of suitable solutions in countries where fuel cards are less established.
Frequently asked questions about reducing fleet fuel costs
Fuel costs can be managed, measured and optimised. Fleeti gives you the four levers that turn this expense into something you control, on your vehicles and machinery, in Europe and Africa.
Fuel costs can be managed, measured and optimised. Fleeti gives you the four levers that turn this expense into something you control, on your vehicles and machinery, in Europe and Africa.
Book a demo

IoT for the operations of African and European businesses.


© 2026 Fleeti SAS