
Fuel management software for business fleets
Fuel management software for business fleets
Fuel management software for business fleets
Fleeti cross-checks your engine data, tank levels and fuel card transactions in real time to manage your fleet's fuel use vehicle by vehicle. You save 15 to 25% on your bill, detect phantom refuels and siphoning immediately, and document your Scope 1 emissions without manual entry.
Fleeti cross-checks your engine data, tank levels and fuel card transactions in real time to manage your fleet's fuel use vehicle by vehicle. You save 15 to 25% on your bill, detect phantom refuels and siphoning immediately, and document your Scope 1 emissions without manual entry.
Book a demo

Fuel management software for business fleets
Fleeti cross-checks your engine data, tank levels and fuel card transactions in real time to manage your fleet's fuel use vehicle by vehicle. You save 15 to 25% on your bill, detect phantom refuels and siphoning immediately, and document your Scope 1 emissions without manual entry.
Book a demo
Cut your fuel bill by 15 to 25%
Cut your fuel bill by 15 to 25%
Cut your fuel bill by 15 to 25%
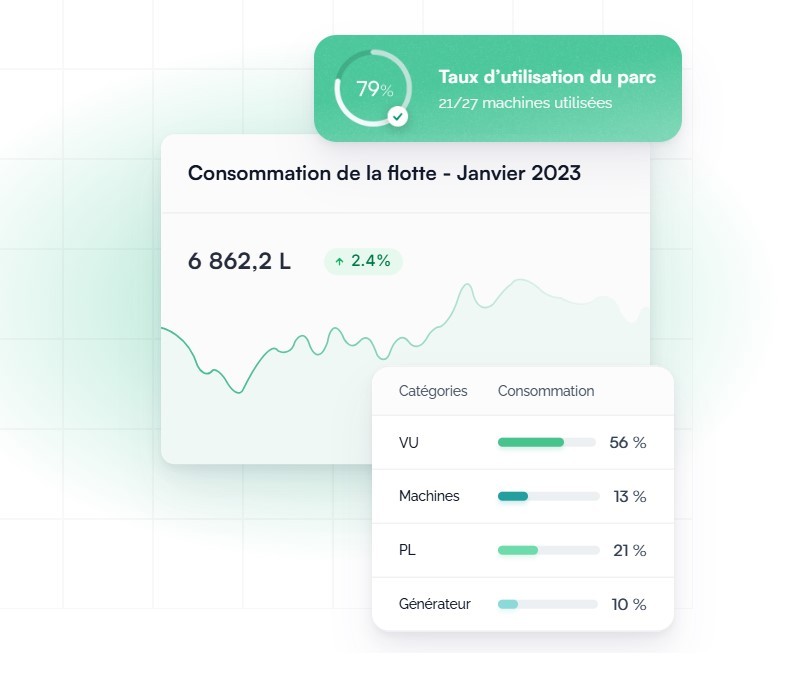
Fuel accounts for 20 to 30% of a business fleet's total cost of ownership, the second-largest expense after payroll. Fleeti continuously identifies vehicles consuming above the fleet average, drivers with costly habits and the most fuel-hungry routes.
Fuel accounts for 20 to 30% of a business fleet's total cost of ownership, the second-largest expense after payroll. Fleeti continuously identifies vehicles consuming above the fleet average, drivers with costly habits and the most fuel-hungry routes.
You automatically cross-check engine data (instant fuel use, idling, speed) with your fuel card transactions and actual mileage. Every discrepancy is logged, dated, geolocated and shown in an exportable dashboard.
You automatically cross-check engine data (instant fuel use, idling, speed) with your fuel card transactions and actual mileage. Every discrepancy is logged, dated, geolocated and shown in an exportable dashboard.
On a fleet of 100 vehicles, a 15% saving means tens of thousands of euros of fuel not burned each year. You set your driving policies on reliable data and justify every euro to your finance department.
On a fleet of 100 vehicles, a 15% saving means tens of thousands of euros of fuel not burned each year. You set your driving policies on reliable data and justify every euro to your finance department.
Detect phantom refuels and siphoning
Detect phantom refuels and siphoning
Detect phantom refuels and siphoning
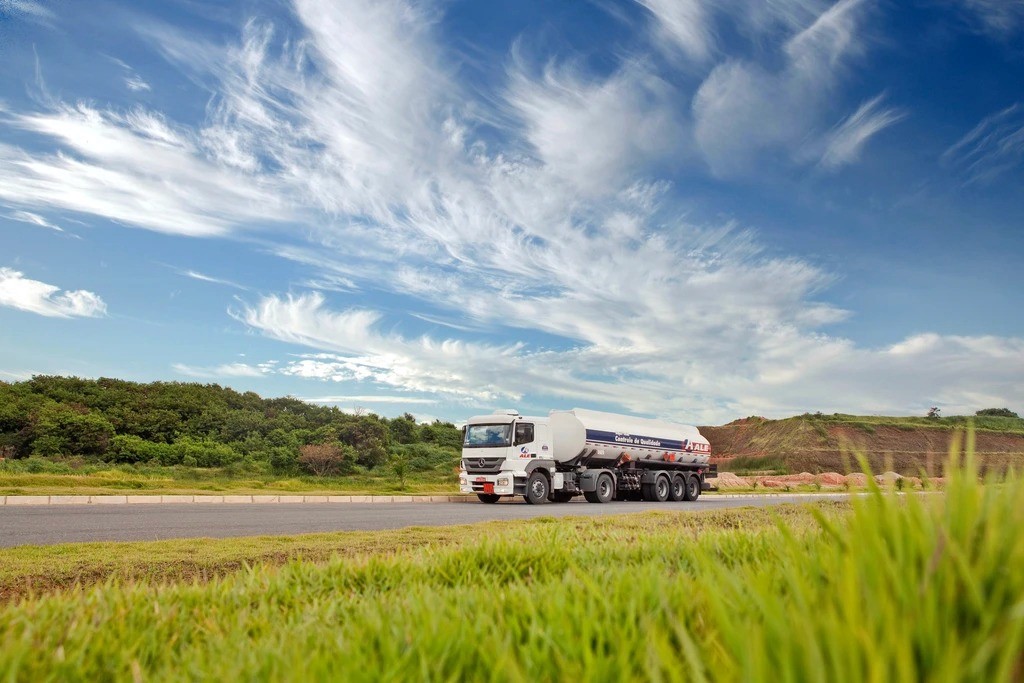
Fuel theft accounts for hundreds of millions of litres of diesel stolen every year. Construction fleets and trucks parked outside secure sites are the most exposed.
Fuel theft accounts for hundreds of millions of litres of diesel stolen every year. Construction fleets and trucks parked outside secure sites are the most exposed.
Fleeti measures tank levels continuously through the CAN bus on recent vehicles, and with capacitive probes on construction machinery and older trucks. Any sudden drop between two trips immediately triggers an alert to the fleet manager and the driver.
Fleeti measures tank levels continuously through the CAN bus on recent vehicles, and with capacitive probes on construction machinery and older trucks. Any sudden drop between two trips immediately triggers an alert to the fleet manager and the driver.
Each fuel card transaction is then matched with the vehicle's GPS position at the time of refuelling. A transaction with no vehicle at the station, or a volume that exceeds tank capacity, is flagged as an anomaly. You have time-stamped, geolocated evidence for any report to your insurer or the police.
Each fuel card transaction is then matched with the vehicle's GPS position at the time of refuelling. A transaction with no vehicle at the station, or a volume that exceeds tank capacity, is flagged as an anomaly. You have time-stamped, geolocated evidence for any report to your insurer or the police.
Manage a reliable cost per km and cost per litre
Manage a reliable cost per km and cost per litre
Manage a reliable cost per km and cost per litre
Self-reported indicators are unreliable: mileage entered by hand, fuel invoices re-keyed, drivers questioned after the fact. Fleeti gives your finance department measured data, comparable month to month and auditable line by line.
Self-reported indicators are unreliable: mileage entered by hand, fuel invoices re-keyed, drivers questioned after the fact. Fleeti gives your finance department measured data, comparable month to month and auditable line by line.
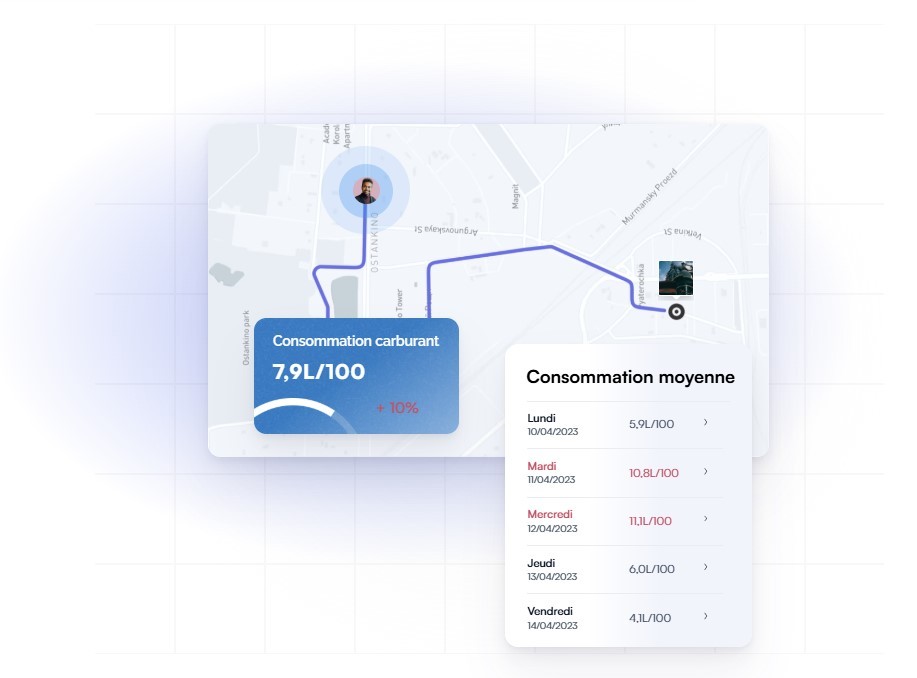
You see the actual cost of fuel by vehicle, driver and site, in euros per kilometre, litres per 100 kilometres, and consumption per engine hour for machinery. Internal benchmarks (top 10%, median, bottom 10%) are calculated automatically, with no setup.
You see the actual cost of fuel by vehicle, driver and site, in euros per kilometre, litres per 100 kilometres, and consumption per engine hour for machinery. Internal benchmarks (top 10%, median, bottom 10%) are calculated automatically, with no setup.
You identify vehicles that need a decision (replacement, reassignment, retirement), document your decisions for your management committee and track the impact of your action plans on your fleet's total cost of ownership.
You identify vehicles that need a decision (replacement, reassignment, retirement), document your decisions for your management committee and track the impact of your action plans on your fleet's total cost of ownership.
Measure machinery and older fleets too
Measure machinery and older fleets too
Measure machinery and older fleets too
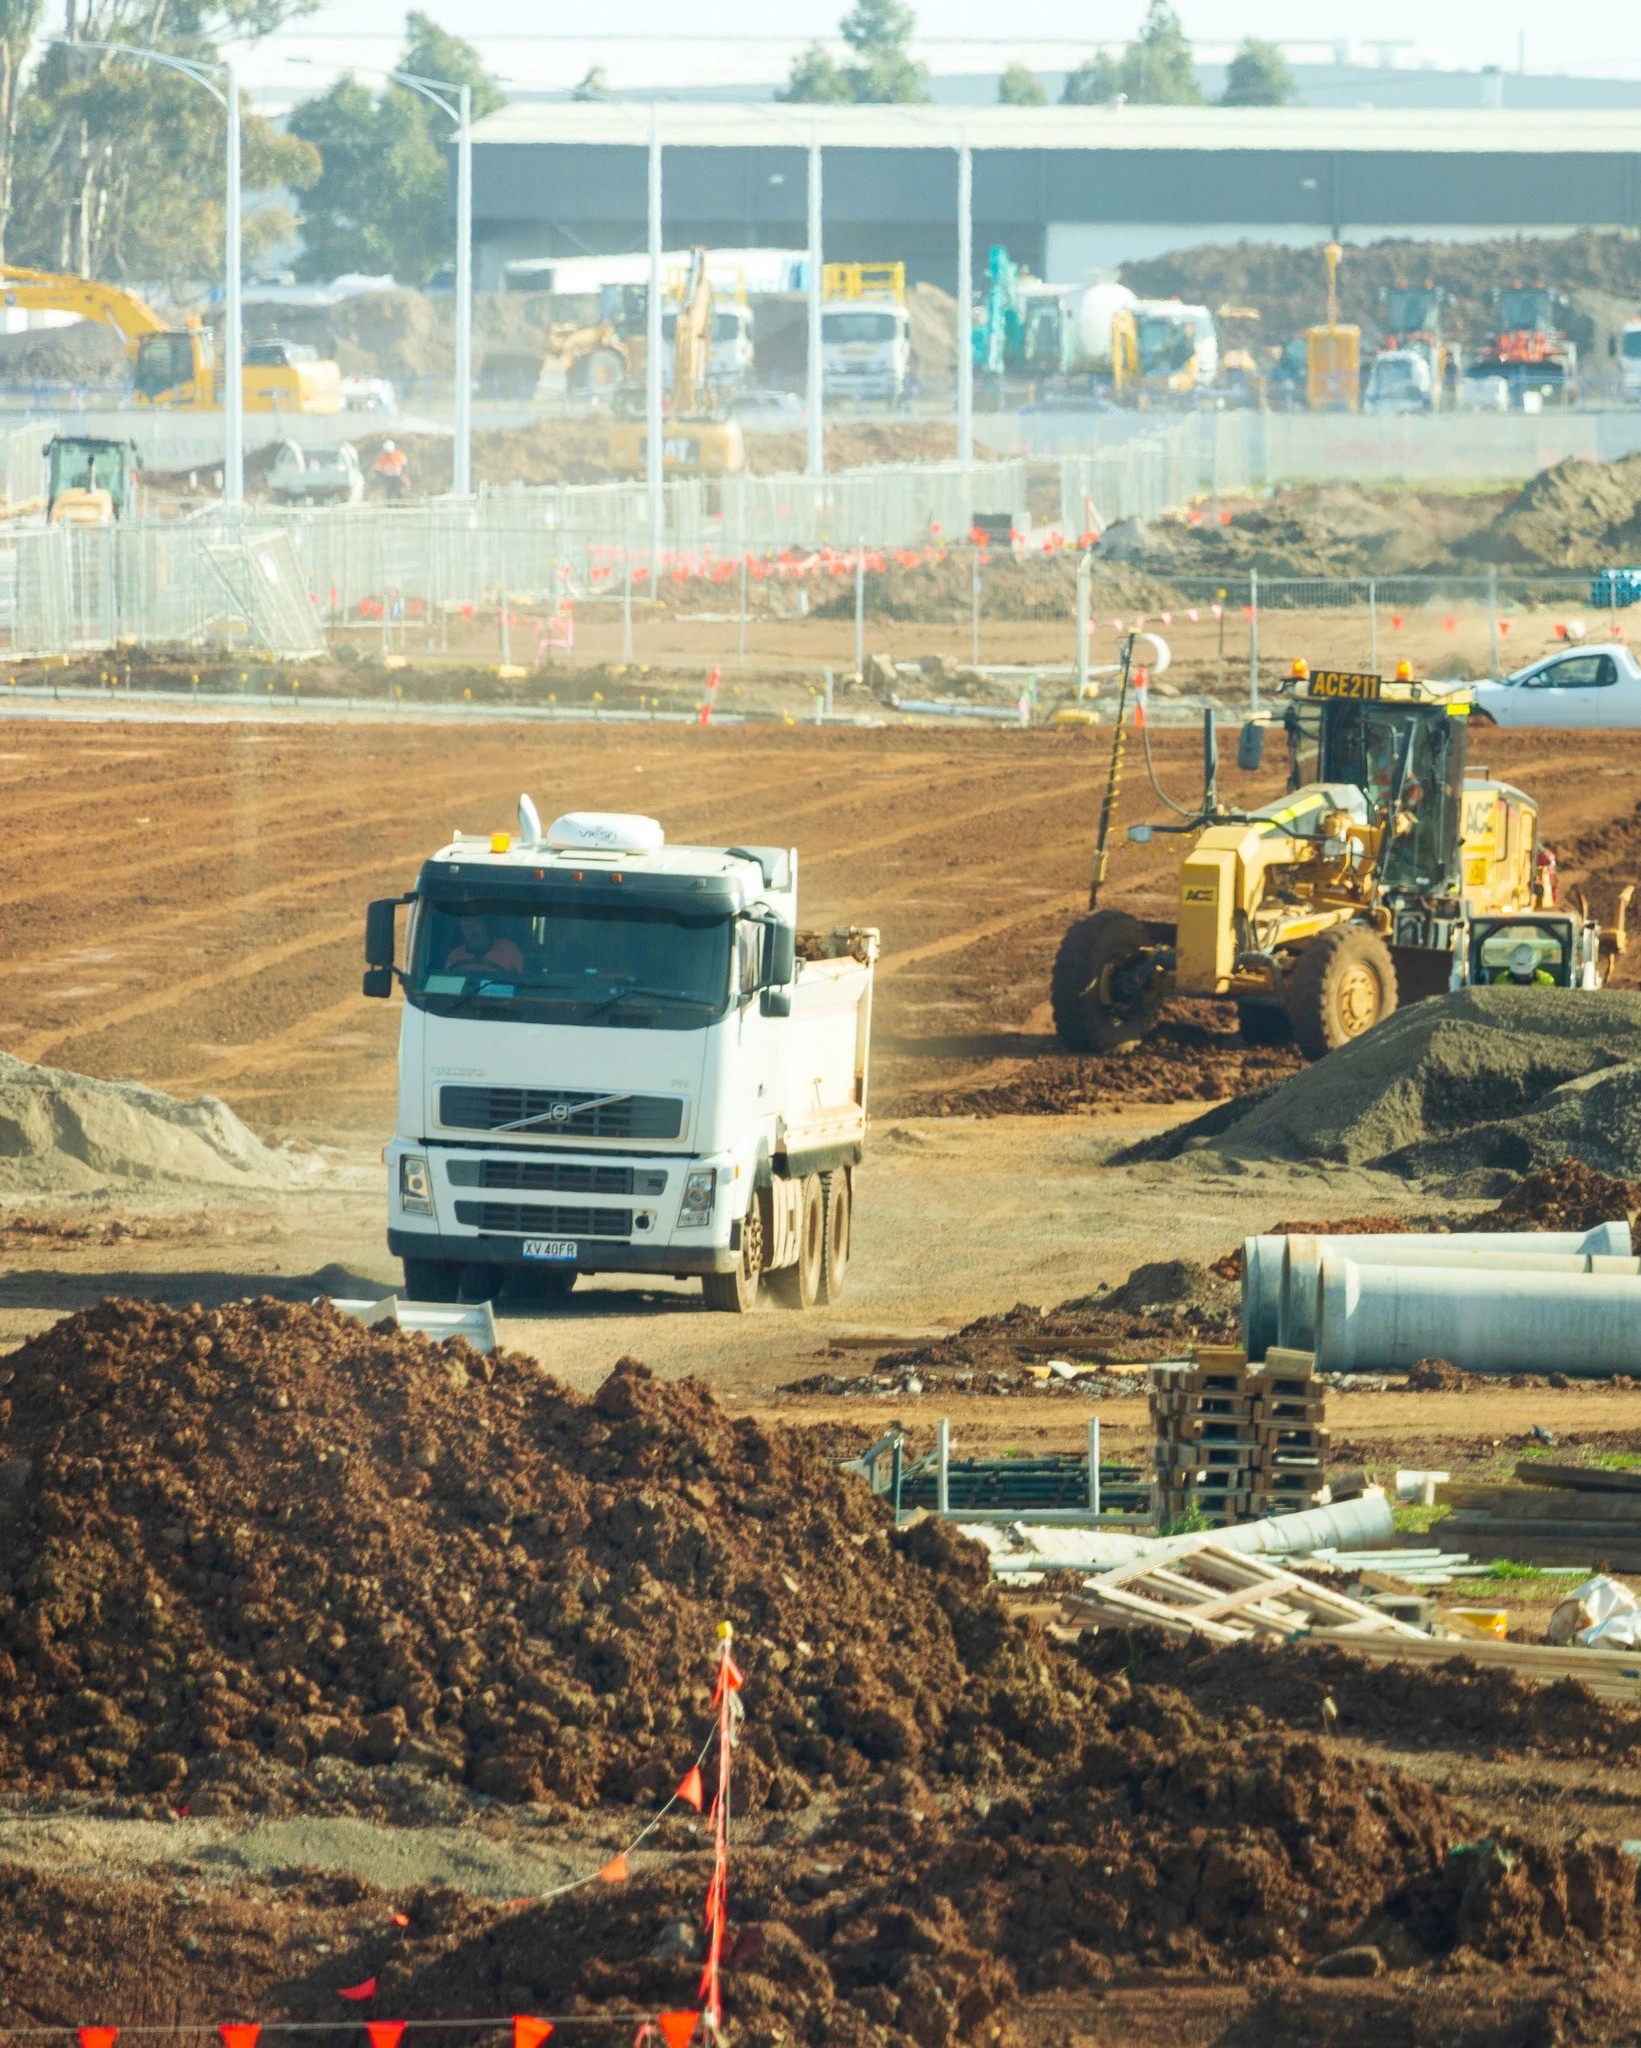
Reading engine data via the CAN bus only works on recent vehicles with the FMS protocol. Mixed fleets (off-road diesel construction machinery, older trucks, short-term rental vans) need a combined approach.
Reading engine data via the CAN bus only works on recent vehicles with the FMS protocol. Mixed fleets (off-road diesel construction machinery, older trucks, short-term rental vans) need a combined approach.
Fleeti uses the right measurement for each type: CAN bus connection for recent vehicles, capacitive tank probes for machinery and trucks, and fuel card integration for office-based fleets without on-board telematics.
Fleeti uses the right measurement for each type: CAN bus connection for recent vehicles, capacitive tank probes for machinery and trucks, and fuel card integration for office-based fleets without on-board telematics.
You get a consistent view of your fuel use, whatever the age of your vehicles, their powertrain (petrol, diesel, off-road diesel, hybrid, electric) or ownership status (owned, long-term lease, short-term rental).
You get a consistent view of your fuel use, whatever the age of your vehicles, their powertrain (petrol, diesel, off-road diesel, hybrid, electric) or ownership status (owned, long-term lease, short-term rental).
Feed your Scope 1 CO₂ reporting automatically
Feed your Scope 1 CO₂ reporting automatically
Every litre of fuel your fleet burns is a greenhouse gas emission counted in your Scope 1, the direct carbon scope under the GHG Protocol. The reliability of your fuel measurement directly determines the reliability of your carbon footprint assessment and CSRD reporting.
Every litre of fuel your fleet burns is a greenhouse gas emission counted in your Scope 1, the direct carbon scope under the GHG Protocol. The reliability of your fuel measurement directly determines the reliability of your carbon footprint assessment and CSRD reporting.
Fleeti automatically converts each measured litre into CO₂-equivalent emissions using current emission factors. The breakdown is shown by vehicle, site and fuel type, and can be exported in a format compatible with your ESG assessment software.
Fleeti automatically converts each measured litre into CO₂-equivalent emissions using current emission factors. The breakdown is shown by vehicle, site and fuel type, and can be exported in a format compatible with your ESG assessment software.
Your fuel tracking becomes a measurable ESG indicator, you document your fleet's decarbonisation pathway for stakeholders, and you prepare electrification decisions on objective data.
Your fuel tracking becomes a measurable ESG indicator, you document your fleet's decarbonisation pathway for stakeholders, and you prepare electrification decisions on objective data.

Book a demo
Key figures for business fleet fuel management
Key figures for business fleet fuel management
Key figures for business fleet fuel management

15 to 25%
15 to 25%
typical fuel bill savings observed after deploying fuel management software in a business.
20 to 30%
20 to 30%
20 to 30%
of a fleet's total cost of ownership goes on fuel, the second-largest item after payroll.
90%
90%
90%
Reduction in fuel theft incidents at companies after deploying the system.
1 950 €
1 950 €
1 950 €
average annual saving per vehicle observed on fleets using a telematics fuel tracking solution.
Fuel used
Fuel used
Fuel used
Total volume consumed, split between fuel burned while driving and fuel burned while stationary with the engine running (idling, power take-off). Measured via the CAN bus or capacitive tank probes, depending on vehicle type.
Total volume consumed, split between fuel burned while driving and fuel burned while stationary with the engine running (idling, power take-off). Measured via the CAN bus or capacitive tank probes, depending on vehicle type.
Total volume consumed, split between fuel burned while driving and fuel burned while stationary with the engine running (idling, power take-off). Measured via the CAN bus or capacitive tank probes, depending on vehicle type.
Average consumption
Average consumption
Average consumption
Litres per 100 kilometres for road vehicles, litres per engine hour for construction machinery. Automatic comparison with the fleet median and manufacturer reference data.
Litres per 100 kilometres for road vehicles, litres per engine hour for construction machinery. Automatic comparison with the fleet median and manufacturer reference data.
Litres per 100 kilometres for road vehicles, litres per engine hour for construction machinery. Automatic comparison with the fleet median and manufacturer reference data.
Tank level
Tank level
Tank level
Real-time fuel level in the tank, with a history of changes. Automatic detection of abnormal drops between two trips and refuels that do not match tank capacity.
Real-time fuel level in the tank, with a history of changes. Automatic detection of abnormal drops between two trips and refuels that do not match tank capacity.
Real-time fuel level in the tank, with a history of changes. Automatic detection of abnormal drops between two trips and refuels that do not match tank capacity.
Cost per km and per litre
Cost per km and per litre
Cost per km and per litre
Actual fuel cost in euros per kilometre and average price paid per litre, calculated by cross-checking engine data with your fuel card transactions. Exportable by vehicle, driver, site and period.
Actual fuel cost in euros per kilometre and average price paid per litre, calculated by cross-checking engine data with your fuel card transactions. Exportable by vehicle, driver, site and period.
Actual fuel cost in euros per kilometre and average price paid per litre, calculated by cross-checking engine data with your fuel card transactions. Exportable by vehicle, driver, site and period.
How our fuel management software works
Fleeti's measurement chain combines on-board hardware, fuel card integrations and anomaly detection algorithms. Four steps, from data collection to your dashboard.
01
01
Engine and tank data measurement
Engine and tank data measurement
Engine and tank data measurement
The Fleeti telematics device continuously collects engine data via the CAN bus or OBD port on recent vehicles. On machinery and older trucks, a capacitive probe installed in the tank measures the fuel level directly, independently of the original control unit.
The Fleeti telematics device continuously collects engine data via the CAN bus or OBD port on recent vehicles. On machinery and older trucks, a capacitive probe installed in the tank measures the fuel level directly, independently of the original control unit.
The Fleeti telematics device continuously collects engine data via the CAN bus or OBD port on recent vehicles. On machinery and older trucks, a capacitive probe installed in the tank measures the fuel level directly, independently of the original control unit.
02
02
Fuel card integration
Fuel card integration
Fuel card integration
Your fuel card transactions flow into Fleeti automatically, whatever your provider. Each refuel is matched to the vehicle, geolocated at its position at the time of the transaction, and compared with the tank's capacity.
Your fuel card transactions flow into Fleeti automatically, whatever your provider. Each refuel is matched to the vehicle, geolocated at its position at the time of the transaction, and compared with the tank's capacity.
Your fuel card transactions flow into Fleeti automatically, whatever your provider. Each refuel is matched to the vehicle, geolocated at its position at the time of the transaction, and compared with the tank's capacity.
03
03
Automatic anomaly detection
Automatic anomaly detection
Automatic anomaly detection
Ten types of discrepancy are identified in real time: sudden drop in tank level between two trips, refuel outside an authorised area, refuel outside working hours, fuel card transaction with no GPS presence of the vehicle at the station, transaction volume exceeding tank capacity, persistent overconsumption compared with the fleet median, excessive idling on a trip, gap between reported and measured mileage, refuel by a driver not authorised for the vehicle, and unusually frequent refuels. Each anomaly triggers an alert to the fleet manager and the driver.
Ten types of discrepancy are identified in real time: sudden drop in tank level between two trips, refuel outside an authorised area, refuel outside working hours, fuel card transaction with no GPS presence of the vehicle at the station, transaction volume exceeding tank capacity, persistent overconsumption compared with the fleet median, excessive idling on a trip, gap between reported and measured mileage, refuel by a driver not authorised for the vehicle, and unusually frequent refuels. Each anomaly triggers an alert to the fleet manager and the driver.
Ten types of discrepancy are identified in real time: sudden drop in tank level between two trips, refuel outside an authorised area, refuel outside working hours, fuel card transaction with no GPS presence of the vehicle at the station, transaction volume exceeding tank capacity, persistent overconsumption compared with the fleet median, excessive idling on a trip, gap between reported and measured mileage, refuel by a driver not authorised for the vehicle, and unusually frequent refuels. Each anomaly triggers an alert to the fleet manager and the driver.
04
04
Dashboard reporting
Dashboard reporting
Dashboard reporting
All data is shown in the Fleeti platform: trip map, tank level curve, refuel history, driver ranking and cost per kilometre by vehicle. Reports can be exported to your finance department and ESG reporting.
All data is shown in the Fleeti platform: trip map, tank level curve, refuel history, driver ranking and cost per kilometre by vehicle. Reports can be exported to your finance department and ESG reporting.
All data is shown in the Fleeti platform: trip map, tank level curve, refuel history, driver ranking and cost per kilometre by vehicle. Reports can be exported to your finance department and ESG reporting.
Which measurement method should you choose: CAN bus, probe or self-reporting?
The right method depends on your fleet type, vehicle age and how much fuel is at stake. Three approaches that complement each other, to mix according to the needs of each vehicle category.
CAN bus / OBD
CAN bus / OBD
CAN bus / OBD
Direct reading of vehicle control unit data via the CAN bus or OBD port. High engine accuracy (instant fuel use, engine speed, idling, speed). Fast installation in under an hour per vehicle.
Direct reading of vehicle control unit data via the CAN bus or OBD port. High engine accuracy (instant fuel use, engine speed, idling, speed). Fast installation in under an hour per vehicle.
Direct reading of vehicle control unit data via the CAN bus or OBD port. High engine accuracy (instant fuel use, engine speed, idling, speed). Fast installation in under an hour per vehicle.
For recent FMS-equipped cars and vans
For recent FMS-equipped cars and vans
For recent FMS-equipped cars and vans
Capacitive probe
Capacitive probe
Capacitive probe
Sensor installed directly in the tank, measuring fuel level independently of the vehicle. High tank accuracy even on machinery, older vehicles and mixed fleets.
Sensor installed directly in the tank, measuring fuel level independently of the vehicle. High tank accuracy even on machinery, older vehicles and mixed fleets.
Sensor installed directly in the tank, measuring fuel level independently of the vehicle. High tank accuracy even on machinery, older vehicles and mixed fleets.
For construction, long-haul transport and high theft-risk areas
For construction, long-haul transport and high theft-risk areas
For construction, long-haul transport and high theft-risk areas
Self-reporting and fuel cards
Self-reporting and fuel cards
Self-reporting and fuel cards
No on-board sensor: mileage entered by the driver in the mobile app, fuel card transactions imported automatically. Lower accuracy, but immediate rollout with no work on the vehicle.
No on-board sensor: mileage entered by the driver in the mobile app, fuel card transactions imported automatically. Lower accuracy, but immediate rollout with no work on the vehicle.
No on-board sensor: mileage entered by the driver in the mobile app, fuel card transactions imported automatically. Lower accuracy, but immediate rollout with no work on the vehicle.
For office-based fleets on long-term lease
For office-based fleets on long-term lease
For office-based fleets on long-term lease
Detect phantom refuels and siphoning in three steps
Fighting fuel theft relies on three combined mechanisms: automatic detection, real-time alerts and traceable evidence. Fleeti automates the whole chain with no manual monitoring.
Automatic detection
Automatic detection
The system identifies any abnormal level drop between two consecutive readings, any refuel outside an authorised area (geolocated filling station) and any transaction volume exceeding tank capacity at the time of refuelling.
The system identifies any abnormal level drop between two consecutive readings, any refuel outside an authorised area (geolocated filling station) and any transaction volume exceeding tank capacity at the time of refuelling.
Step 1 of 3 · Continuous monitoring
Step 1 of 3 · Continuous monitoring
Real-time alert
Real-time alert
A notification is sent immediately to the fleet manager by email or push notification, and to the driver through the Fleeti mobile app. You can act before the loss happens again, or before the vehicle leaves the site.
A notification is sent immediately to the fleet manager by email or push notification, and to the driver through the Fleeti mobile app. You can act before the loss happens again, or before the vehicle leaves the site.
Step 2 of 3 · Immediate response
Step 2 of 3 · Immediate response
Time-stamped evidence
Time-stamped evidence
Each anomaly is archived with its date, GPS position, fuel level before and after the event, and the related transaction where relevant. This traceability provides the evidence needed for an insurance claim or a police report.
Each anomaly is archived with its date, GPS position, fuel level before and after the event, and the related transaction where relevant. This traceability provides the evidence needed for an insurance claim or a police report.
Step 3 of 3 · Enforceable evidence file
Step 3 of 3 · Enforceable evidence file
Fleeti fuel management software by industry and country
Fleeti deploys its fuel solution across every type of business fleet, in France and in several regions where fuel control is a strategic profitability issue.
Field services
Field services
A multi-trade maintenance company with 200 vans deploys Fleeti to manage fuel use vehicle by vehicle. Identifying high consumers and training drivers in a targeted way typically reduces the fuel bill by 15 to 18% in under a year, or tens of thousands of euros a year. The tracking also feeds driver TCO calculation and the renegotiation of long-term lease contracts.
A multi-trade maintenance company with 200 vans deploys Fleeti to manage fuel use vehicle by vehicle. Identifying high consumers and training drivers in a targeted way typically reduces the fuel bill by 15 to 18% in under a year, or tens of thousands of euros a year. The tracking also feeds driver TCO calculation and the renegotiation of long-term lease contracts.
France · Fuel use and TCO tracking
France · Fuel use and TCO tracking
Construction and machinery
Construction and machinery
A civil engineering company fits its off-road diesel machinery (excavators, loaders, compactors) with Fleeti capacitive probes. Anti-siphoning alerts typically cut theft losses fivefold on unguarded sites. Engine hour tracking also helps optimise the fleet replacement schedule and preventive maintenance planning.
A civil engineering company fits its off-road diesel machinery (excavators, loaders, compactors) with Fleeti capacitive probes. Anti-siphoning alerts typically cut theft losses fivefold on unguarded sites. Engine hour tracking also helps optimise the fleet replacement schedule and preventive maintenance planning.
France · Theft prevention and engine hours
France · Theft prevention and engine hours
Long-haul transport
Long-haul transport
A transport company operating in West Africa secures its truck fleet with capacitive probes and fuel card cross-checks. Fuel accounts for up to 40% of operating costs in these markets, and theft can reach 5 to 10% of the volume purchased. Deploying Fleeti typically brings these losses below 1% in under six months.
A transport company operating in West Africa secures its truck fleet with capacitive probes and fuel card cross-checks. Fuel accounts for up to 40% of operating costs in these markets, and theft can reach 5 to 10% of the volume purchased. Deploying Fleeti typically brings these losses below 1% in under six months.
West Africa · Truck fleet security
West Africa · Truck fleet security
Frequently asked questions about fleet fuel management
Fuel management is a daily operational tool, not a monthly Excel exercise. Measure continuously, detect anomalies in real time and save 15 to 25% in under twelve months. Fleeti gives you the tools to do it without adding to your drivers' workload.
Fuel management is a daily operational tool, not a monthly Excel exercise. Measure continuously, detect anomalies in real time and save 15 to 25% in under twelve months. Fleeti gives you the tools to do it without adding to your drivers' workload.



IoT for the operations of African and European businesses.
© 2026 Fleeti SAS